iMeta | 复杂热图(ComplexHeatmap)可视化文章最新版,画热图就引它_生信宝典的博客-CSDN博客
作者贡献
顾祖光:研究课题的提出和设计, 软件编写,可视化,数据分析,论文编写,修订和审阅。
代码和数据可用性
ComplexHeatmap 的稳定版本发布在 https://bioconductor.org/packages/ComplexHeatmap/
开发者版本发布在https://github.com/jokergoo/ComplexHeatmap,
文档发布在
https://jokergoo.github.io/ComplexHeatmap-reference/book/
论文中绘制图1到图6的代码发布在
https://github.com/jokergoo/ComplexHeatmap_v2_paper_code
数据下载

作图
数据
##有9块数据
rm(list = ls())
library(ComplexHeatmap)
library(circlize)
library(RColorBrewer)
# 载入示例数据
res_list = readRDS("meth.rds")
str(res_list)##查看数据格式,便于数据提取#进行数据提取:共有9大块数据类型
type = res_list$type
mat_meth = res_list$mat_meth
mat_expr = res_list$mat_expr
direction = res_list$direction
cor_pvalue = res_list$cor_pvalue
gene_type = res_list$gene_type
anno_gene = res_list$anno_gene
dist = res_list$dist
anno_enhancer = res_list$anno_enhancer
List of 9$ type : chr [1:20] "Tumor" "Tumor" "Tumor" "Tumor" ...$ mat_meth : num [1:1000, 1:20] 0.0951 0.1789 0.1988 0.3331 0.3731 .....- attr(*, "dimnames")=List of 2.. ..$ : NULL.. ..$ : chr [1:20] "sample1" "sample2" "sample3" "sample4" ...$ mat_expr : num [1:1000, 1:20] 1.2638 -0.6938 0.5577 0.0853 -0.2573 .....- attr(*, "dimnames")=List of 2.. ..$ : NULL.. ..$ : chr [1:20] "sample1" "sample2" "sample3" "sample4" ...$ direction : chr [1:1000] "hypo" "hypo" "hypo" "hyper" ...$ cor_pvalue : num [1:1000] 0.656 0.5782 0.3495 0.0287 1.2388 ...$ gene_type : chr [1:1000] "protein_coding" "psedo-gene" "psedo-gene" "lincRNA" ...$ anno_gene : chr [1:1000] "intergenic" "intergenic" "intergenic" "intergenic" ...$ dist : num [1:1000] 388737 97280 36426 420011 355666 ...$ anno_enhancer: num [1:1000, 1:3] 0.072 0.758 0 0 0.571 .....- attr(*, "dimnames")=List of 2.. ..$ : NULL.. ..$ : chr [1:3] "enhancer_1" "enhancer_2" "enhancer_3"图探索
颜色及注释
column_tree = hclust(dist(t(mat_meth)))#根据mat_meth 列(样本)进行聚类
column_order = column_tree$order#为了后面统一mat_expr 矩阵的顺序
##根据type数据显示前10个为肿瘤,后10个为对照(聚类癌与癌旁结果区分明确)
#[1]  8  6  5  7  4 10  3  9  1  2 | 12 18 15 19 13 14 16 17 11 20#颜色设置
library(RColorBrewer)
meth_col_fun = colorRamp2(c(0, 0.5, 1), c("blue", "white", "red"))
direction_col = c("hyper" = "red", "hypo" = "blue")
expr_col_fun = colorRamp2(c(-2, 0, 2), c("green", "white", "red"))
pvalue_col_fun = colorRamp2(c(0, 2, 4), c("white", "white", "red"))
gene_type_col = structure(brewer.pal(length(unique(gene_type)), "Set3"), names = unique(gene_type))
anno_gene_col = structure(brewer.pal(length(unique(anno_gene)), "Set1"), names = unique(anno_gene))
dist_col_fun = colorRamp2(c(0, 10000), c("black", "white"))
enhancer_col_fun = colorRamp2(c(0, 1), c("white", "orange"))#We first define two column annotations and then make the complex heatmaps.
#ht_opt(
#  legend_title_gp = gpar(fontsize = 8, fontface = "bold"),
#  legend_labels_gp = gpar(fontsize = 8),
#  heatmap_column_names_gp = gpar(fontsize = 8),
#  heatmap_column_title_gp = gpar(fontsize = 10),
#  heatmap_row_title_gp = gpar(fontsize = 8)
#)#列注释信息
ha = HeatmapAnnotation(type = type, col = list(type = c("Tumor" = "pink", "Control" = "royalblue")),annotation_name_side = "left")#注释名左侧
ha2 = HeatmapAnnotation(type = type, col = list(type = c("Tumor" = "pink", "Control" = "royalblue")), show_legend = FALSE)#不在显示图例(与第一个重复)
出图代码
##绘图:Heatmap+Heatmap的方式进行合并
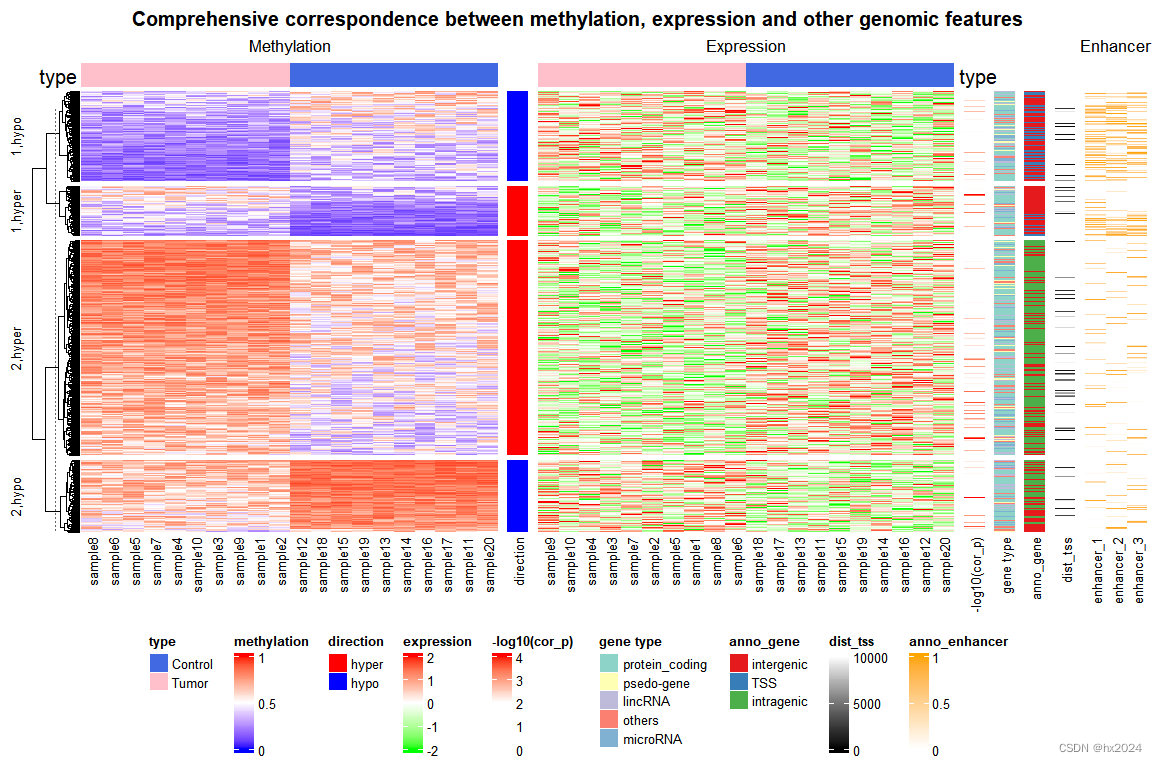
p <- draw(Heatmap(mat_meth, name = "methylation", col = meth_col_fun,column_order= column_order,top_annotation = ha, column_title = "Methylation")+Heatmap(direction, name = "direction", col = direction_col) +Heatmap(mat_expr[, column_tree$order], name = "expression", col = expr_col_fun, column_order = column_order, top_annotation = ha2, column_title = "Expression"),row_km = 2, #对两个部分进行行聚类row_split = direction)#根据direction对行切分
绘制原图
ht_list = Heatmap(mat_meth, name = "methylation", col = meth_col_fun,column_order= column_order,top_annotation = ha, column_title = "Methylation") +Heatmap(direction, name = "direction", col = direction_col) +Heatmap(mat_expr[, column_tree$order], name = "expression", col = expr_col_fun, column_order = column_order, top_annotation = ha2, column_title = "Expression") +Heatmap(cor_pvalue, name = "-log10(cor_p)", col = pvalue_col_fun) +Heatmap(gene_type, name = "gene type", col = gene_type_col) +Heatmap(anno_gene, name = "anno_gene", col = anno_gene_col) +Heatmap(dist, name = "dist_tss", col = dist_col_fun) +Heatmap(anno_enhancer, name = "anno_enhancer", col = enhancer_col_fun, cluster_columns = FALSE, column_title = "Enhancer")
#pdf('complex_heatmap.pdf',width = 12,height = 8)
draw(ht_list, row_km = 2, row_split = direction,column_title = "Comprehensive correspondence between methylation, expression and other genomic features", column_title_gp = gpar(fontsize = 12, fontface = "bold"), merge_legends = TRUE, heatmap_legend_side = "bottom")
dev.off()

R实战 | 复杂热图3.0(ComplexHeatmap) (qq.com)
快速入门ComplexHeatmap包:理解绘制复杂热图的多种参数设置 (qq.com)
tidyHeatmap使用长数据绘制热图 (qq.com)


![[Docker]十一.Docker Swarm集群raft算法,Docker Swarm Web管理工具](https://img-blog.csdnimg.cn/86d781d8cc1d4c5480ab636243ae9f7c.png)


