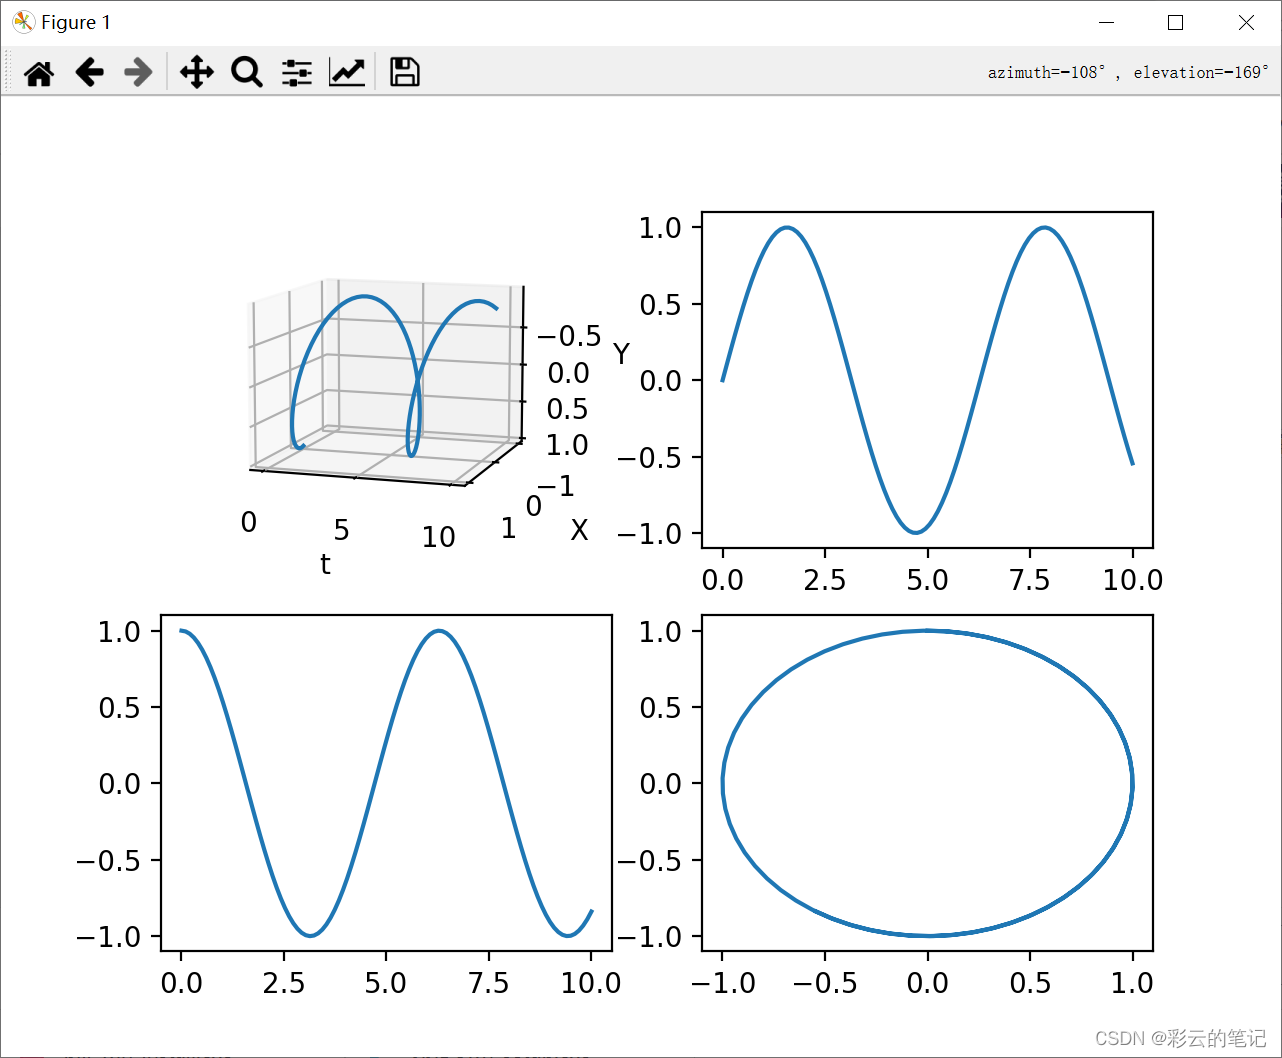
import matplotlib.pyplot as plt
from mpl_toolkits.mplot3d import Axes3D
import numpy as np# 创建一个三维坐标轴
fig = plt.figure()
ax = fig.add_subplot(221, projection='3d')
xx = fig.add_subplot(222)
yy = fig.add_subplot(223)
xy = fig.add_subplot(224)# 生成示例数据
t = np.linspace(0, 10, 100)  # 时间范围从0到10,总共取100个点
x = np.sin(t)  # X轴数据,这里使用正弦函数作为示例
y = np.cos(t)  # Y轴数据,这里使用余弦函数作为示例# 绘制曲线图
ax.plot(t, x, y)
xx.plot(t,x)
yy.plot(t,y)
xy.plot(x,y)# 设置坐标轴标签
ax.set_xlabel('t')
ax.set_ylabel('X')
ax.set_zlabel('Y')# 显示图形
plt.show()


