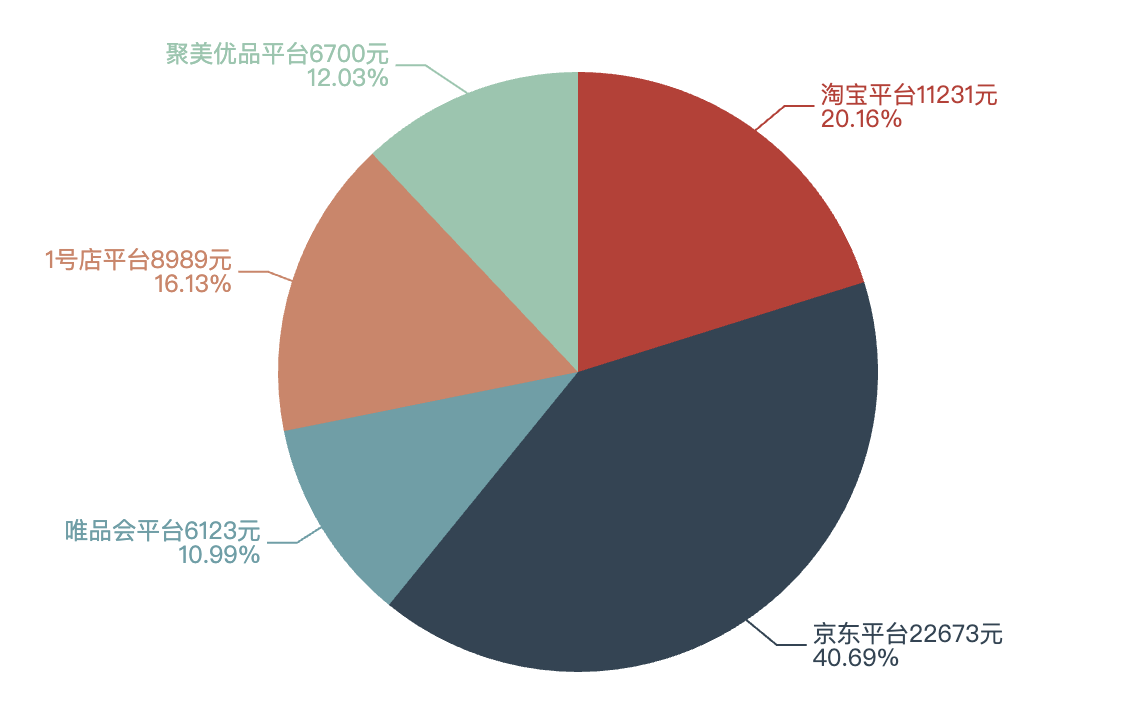
1 基本使用
<!DOCTYPE html>
<html lang="en"><head><meta charset="UTF-8"><meta name="viewport" content="width=device-width, initial-scale=1.0"><meta http-equiv="X-UA-Compatible" content="ie=edge"><title>Document</title><script src="lib/echarts.min.js"></script>
</head><body><div style="width: 600px;height:400px"></div><script>var mCharts = echarts.init(document.querySelector("div"))var pieData = [{name: '淘宝',value: 11231},{name: '京东',value: 22673},{name: '唯品会',value: 6123},{name: '1号店',value: 8989},{name: '聚美优品',value: 6700}]var option = {series: [{type: 'pie',data: pieData,label: { // 饼图文字的显示show: true, // 显示文字//formatter: 'hehe' // 决定文字显示的内容formatter: function(arg){// console.log(arg)return arg.name + '平台' + arg.value + '元\n' + arg.percent + '%'}},}]}mCharts.setOption(option)</script>
</body></html>
2 圆环
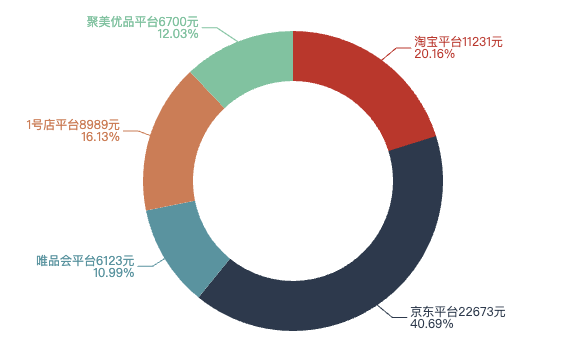
主要是设置半径radius
<!DOCTYPE html>
<html lang="en"><head><meta charset="UTF-8"><meta name="viewport" content="width=device-width, initial-scale=1.0"><meta http-equiv="X-UA-Compatible" content="ie=edge"><title>Document</title><script src="lib/echarts.min.js"></script>
</head><body><div style="width: 600px;height:400px"></div><script>var mCharts = echarts.init(document.querySelector("div"))var pieData = [{name: '淘宝',value: 11231},{name: '京东',value: 22673},{name: '唯品会',value: 6123},{name: '1号店',value: 8989},{name: '聚美优品',value: 6700}]var option = {series: [{type: 'pie',data: pieData,label: { // 饼图文字的显示show: true, // 显示文字//formatter: 'hehe' // 决定文字显示的内容formatter: function(arg){// console.log(arg)return arg.name + '平台' + arg.value + '元\n' + arg.percent + '%'}},// radius: '20%' // 百分比参照的是宽度和高度中较小的那一部分的一半来进行百分比设置radius: ['50%', '75%'] // 第0个元素代表的是內圆的半径 第1个元素外圆的半径}]}mCharts.setOption(option)</script>
</body></html>
3 南丁格尔图

<!DOCTYPE html>
<html lang="en"><head><meta charset="UTF-8"><meta name="viewport" content="width=device-width, initial-scale=1.0"><meta http-equiv="X-UA-Compatible" content="ie=edge"><title>Document</title><script src="lib/echarts.min.js"></script>
</head><body><div style="width: 600px;height:400px"></div><script>var mCharts = echarts.init(document.querySelector("div"))var pieData = [{name: '淘宝',value: 11231},{name: '京东',value: 22673},{name: '唯品会',value: 6123},{name: '1号店',value: 8989},{name: '聚美优品',value: 6700}]var option = {series: [{type: 'pie',data: pieData,label: { show: true, // 显示文字formatter: function(arg){return arg.name + '平台' + arg.value + '元\n' + arg.percent + '%'}},roseType: 'radius', // 南丁格尔图 饼图的每一个区域的半径是不同的// selectedMode: 'single' // 选中的效果,能够将选中的区域偏离圆点一小段距离selectedMode: 'multiple',selectedOffset: 30}]}mCharts.setOption(option)</script>
</body></html>