集成学习应用实践
import numpy as np
import os
%matplotlib inline
import matplotlib
import matplotlib.pyplot as plt
plt.rcParams['axes.labelsize'] = 14
plt.rcParams['xtick.labelsize'] = 12
plt.rcParams['ytick.labelsize'] = 12
import warnings
warnings.filterwarnings ('ignore')
np.random.seed (42)
1. 单个模型和集成模型的硬/软投票比较
from sklearn.model_selection import train_test_split
from sklearn.datasets import make_moonsX, y = make_moons(n_samples=500, noise=0.30, random_state=42)
X_train, X_test, y_train, y_test = train_test_split (X, y, random_state=42)
plt.plot(X[:,0][y==0], X[:, 1][y==0],'yo', alpha = 0.6)
plt.plot(X[:,0][y==1], X[:, 1][y==1],'bs', alpha = 0.6)
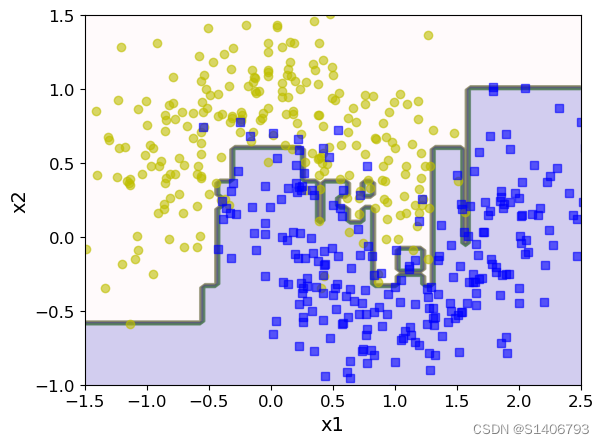
硬投票实验
from sklearn.ensemble import RandomForestClassifier, VotingClassifier
from sklearn.linear_model import LogisticRegression
from sklearn.svm import SVC
# 构建分类器
log_clf = LogisticRegression()
rnd_clf = RandomForestClassifier()
svm_clf = SVC()voting_clf = VotingClassifier(estimators=[('lr' ,log_clf),('rf',rnd_clf),('svm',svm_clf)], voting='hard')
voting_clf.fit(X_train,y_train)
VotingClassifier(estimators=[('lr', LogisticRegression()),('rf', RandomForestClassifier()), ('svm', SVC())])
from sklearn.metrics import accuracy_score
for clf in (log_clf , rnd_clf, svm_clf, voting_clf):  #比较单个模型和集成模型的分类结果clf.fit(X_train,y_train)y_pred = clf.predict(X_test)print(clf.__class__.__name__, accuracy_score(y_test, y_pred))
LogisticRegression 0.864
RandomForestClassifier 0.88
SVC 0.896
VotingClassifier 0.904
软投票实验: 效果比硬投票更靠谱
from sklearn.ensemble import RandomForestClassifier, VotingClassifier
from sklearn.linear_model import LogisticRegression
from sklearn.svm import SVC
# 构建分类器
log_clf = LogisticRegression(random_state=42)
rnd_clf = RandomForestClassifier(random_state=42)
# 逻辑回归和随机森林都可以得到一个概率值,SVM中需要加一个参数
svm_clf = SVC(random_state=42,probability = True)voting_clf = VotingClassifier(estimators=[('lr' ,log_clf),('rf',rnd_clf),('svm',svm_clf)], voting='soft')
voting_clf.fit(X_train,y_train)
VotingClassifier(estimators=[('lr', LogisticRegression(random_state=42)),('rf', RandomForestClassifier(random_state=42)),('svm', SVC(probability=True, random_state=42))],voting='soft')
from sklearn.metrics import accuracy_score
for clf in (log_clf , rnd_clf, svm_clf, voting_clf):clf.fit(X_train,y_train)y_pred = clf.predict(X_test)print(clf.__class__.__name__, accuracy_score(y_test,y_pred))
LogisticRegression 0.864
RandomForestClassifier 0.896
SVC 0.896
VotingClassifier 0.92
2. 单个树模型和Bagging比较
from sklearn.ensemble import BaggingClassifier
from sklearn.tree import DecisionTreeClassifier
bag_clf = BaggingClassifier(DecisionTreeClassifier(), n_estimators = 500,max_samples = 100,bootstrap = True,  #是否进行又放回抽样n_jobs = -1,random_state = 42)
bag_clf.fit(X_train, y_train)
y_pred = bag_clf.predict(X_test)
from sklearn.metrics import accuracy_score
print(bag_clf.__class__.__name__, accuracy_score(y_test,y_pred))
BaggingClassifier 0.904
tree_clf = DecisionTreeClassifier()
tree_clf.fit(X_train,y_train)
y_pred_tree = tree_clf.predict(X_test)
print(bag_clf.__class__.__name__, accuracy_score(y_test,y_pred_tree))
BaggingClassifier 0.864
决策边界:
- 集成和传统方法对比
from matplotlib.colors import ListedColormap
def plot_decision_boundary(clf, X, y, axes=[-1.5, 2.5, -1, 1.5], alpha=0.5, contour=True):x1s = np.linspace(axes[0], axes[1], 100)  # 在x1范围内生成100个均匀间隔的值x2s = np.linspace(axes[2], axes[3], 100)  # 在x2范围内生成100个均匀间隔的值x1, x2 = np.meshgrid(x1s, x2s)  # 创建一个网格,将x1和x2的值组合成所有可能的坐标点X_new = np.c_[x1.ravel(), x2.ravel()]  # 将x1和x2的坐标点展平并连接在一起,得到新的特征矩阵y_pred = clf.predict(X_new).reshape(x1.shape)  # 使用分类器预测新的特征矩阵的类别,并将结果重塑为与x1形状相同的数组# 绘制决策边界的背景颜色custom_cmap1 = ListedColormap(['#FFF0F5', '#E6E6FA', '#6A5ACD'])plt.contourf(x1, x2, y_pred, cmap=custom_cmap1, alpha=0.3)if contour:# 绘制决策边界的线条custom_cmap2 = ListedColormap(['#7d7d58', '#4c4c7f', '#507d50'])plt.contour(x1, x2, y_pred, cmap=custom_cmap2, alpha=0.6)# 绘制样本点plt.plot(X[:, 0][y == 0], X[:, 1][y == 0], 'yo', alpha=0.6)  # 类别为0的样本点用黄色圆圈表示plt.plot(X[:, 0][y == 1], X[:, 1][y == 1], 'bs', alpha=0.6)  # 类别为1的样本点用蓝色方块表示plt.axis(axes)  # 设置坐标轴范围plt.xlabel('x1')  # 设置x轴标签plt.ylabel('x2')  # 设置y轴标签
plt.figure(figsize = (12,5))
plt.subplot(121)
plot_decision_boundary(tree_clf,X,y)
plt.title('Decision Tree')
plt.subplot(122)
plot_decision_boundary(bag_clf,X,y)
plt.title('Decision Tree With Bagging')
Text(0.5, 1.0, 'Decision Tree With Bagging')

Colormap顔色:https://blog.csdn.net/qq_42804678/article/details/99607026
OOB策略
- Out Of Bag
bag_clf = BaggingClassifier(DecisionTreeClassifier(), n_estimators = 500,max_samples = 100,bootstrap = True,  #是否进行又放回抽样n_jobs = -1,random_state = 42,oob_score=True)
bag_clf.fit(X_train,y_train)
bag_clf.oob_score_   #计算袋外(Out-of-Bag)分数,即使用未在训练中使用的样本进行评估的准确率
0.9253333333333333
- 和测试集上的结果是否一致呢?
一般来说,验证集都比测试集高一些
y_pred = bag_clf.predict(X_test)
from sklearn.metrics import accuracy_score
print(bag_clf.__class__.__name__, accuracy_score(y_test,y_pred))
BaggingClassifier 0.904
bag_clf.oob_decision_function_
#返回每个训练样本在两个类别上的概率值
array([[0.35579515, 0.64420485],[0.43513514, 0.56486486],[1. , 0. ],[0.01030928, 0.98969072],[0.03174603, 0.96825397],[0.07672634, 0.92327366],[0.39189189, 0.60810811],[0.06145251, 0.93854749],[0.92689295, 0.07310705],[0.88205128, 0.11794872],[0.59850374, 0.40149626],[0.04896907, 0.95103093],[0.7565445 , 0.2434555 ],[0.81377551, 0.18622449],[0.88528678, 0.11471322],[0.07407407, 0.92592593],[0.04738155, 0.95261845],[0.92051282, 0.07948718],[0.69974555, 0.30025445],[0.94358974, 0.05641026],[0.06100796, 0.93899204],[0.224 , 0.776 ],[0.9125964 , 0.0874036 ],[0.98746867, 0.01253133],[0.95967742, 0.04032258],[0. , 1. ],[0.94255875, 0.05744125],[1. , 0. ],[0.03466667, 0.96533333],[0.7020202 , 0.2979798 ],[0. , 1. ],[1. , 0. ],[0.01262626, 0.98737374],[0.07772021, 0.92227979],[0.09350649, 0.90649351],[0.97889182, 0.02110818],[0.01827676, 0.98172324],[0.53191489, 0.46808511],[0.02122016, 0.97877984],[0.98979592, 0.01020408],[0.10242588, 0.89757412],[0.33773087, 0.66226913],[0.98684211, 0.01315789],[0.98714653, 0.01285347],[0.00755668, 0.99244332],[1. , 0. ],[1. , 0. ],[0.05691057, 0.94308943],[0.97727273, 0.02272727],[0.05420054, 0.94579946],[0.9443038 , 0.0556962 ],[0.78740157, 0.21259843],[0.92467532, 0.07532468],[0.81794195, 0.18205805],[0.01758794, 0.98241206],[0.09511568, 0.90488432],[0.78296703, 0.21703297],[0.01897019, 0.98102981],[0.01344086, 0.98655914],[0.01492537, 0.98507463],[0.82170543, 0.17829457],[0.66666667, 0.33333333],[0.71900826, 0.28099174],[0.9921875 , 0.0078125 ],[0.01049869, 0.98950131],[0.7513369 , 0.2486631 ],[0.97727273, 0.02272727],[0.99230769, 0.00769231],[0.60367454, 0.39632546],[0.98461538, 0.01538462],[0.35824742, 0.64175258],[0.30666667, 0.69333333],[0.41621622, 0.58378378],[0.72922252, 0.27077748],[0. , 1. ],[0.25 , 0.75 ],[0.9015544 , 0.0984456 ],[1. , 0. ],[0.0302267 , 0.9697733 ],[0.95844156, 0.04155844],[0.00512821, 0.99487179],[0.18441558, 0.81558442],[0.13554987, 0.86445013],[0.40502793, 0.59497207],[0.98704663, 0.01295337],[0.04381443, 0.95618557],[0.67307692, 0.32692308],[0.07341772, 0.92658228],[0.01578947, 0.98421053],[0. , 1. ],[0.38046272, 0.61953728],[1. , 0. ],[0.01754386, 0.98245614],[0.05277045, 0.94722955],[0.01028278, 0.98971722],[0.80851064, 0.19148936],[0.7115903 , 0.2884097 ],[0.07407407, 0.92592593],[1. , 0. ],[0.34473684, 0.65526316],[0.66402116, 0.33597884],[0.01542416, 0.98457584],[0.12266667, 0.87733333],[0.42746114, 0.57253886],[0.97142857, 0.02857143],[0.03899721, 0.96100279],[0.97493734, 0.02506266],[0.44235925, 0.55764075],[0.27968338, 0.72031662],[0.9974026 , 0.0025974 ],[0.24403183, 0.75596817],[0.85233161, 0.14766839],[0.26329114, 0.73670886],[0.77653631, 0.22346369],[0.9893617 , 0.0106383 ],[0.98663102, 0.01336898],[0. , 1. ],[0. , 1. ],[0.48849105, 0.51150895],[0.99162011, 0.00837989],[0.06793478, 0.93206522],[0.9895288 , 0.0104712 ],[0.97704082, 0.02295918],[1. , 0. ],[0.95561358, 0.04438642],[0.97777778, 0.02222222],[0.03580563, 0.96419437],[0.95760599, 0.04239401],[0.96508728, 0.03491272],[0.02887139, 0.97112861],[0.23306233, 0.76693767],[0.85529716, 0.14470284],[0.4015544 , 0.5984456 ],[0.91948052, 0.08051948],[0.002457 , 0.997543 ],[0.0265252 , 0.9734748 ],[0.82849604, 0.17150396],[0.76863753, 0.23136247],[0.5390625 , 0.4609375 ],[0.88664987, 0.11335013],[0.93814433, 0.06185567],[0.1171875 , 0.8828125 ],[0.76923077, 0.23076923],[0.08136483, 0.91863517],[0.01282051, 0.98717949],[0.1227154 , 0.8772846 ],[0.73969072, 0.26030928],[0.96946565, 0.03053435],[1. , 0. ],[0.03403141, 0.96596859],[0.00265957, 0.99734043],[0.0620155 , 0.9379845 ],[0.02325581, 0.97674419],[0.9924812 , 0.0075188 ],[0.98373984, 0.01626016],[0.86449864, 0.13550136],[0.99730458, 0.00269542],[1. , 0. ],[0.87598945, 0.12401055],[0.00775194, 0.99224806],[0.64925373, 0.35074627],[0.32994924, 0.67005076],[0.07336957, 0.92663043],[0.01534527, 0.98465473],[0.38961039, 0.61038961],[1. , 0. ],[0.97554348, 0.02445652],[0. , 1. ],[1. , 0. ],[0.07027027, 0.92972973],[0.00520833, 0.99479167],[0.92553191, 0.07446809],[0.02077922, 0.97922078],[0. , 1. ],[1. , 0. ],[0.04347826, 0.95652174],[0.82994924, 0.17005076],[0.90526316, 0.09473684],[0.033241 , 0.966759 ],[0.94559585, 0.05440415],[0.90185676, 0.09814324],[0.9611399 , 0.0388601 ],[0.01312336, 0.98687664],[0.01856764, 0.98143236],[0.99212598, 0.00787402],[0.24427481, 0.75572519],[0.98958333, 0.01041667],[0.12634409, 0.87365591],[0.01808786, 0.98191214],[0.98969072, 0.01030928],[0. , 1. ],[0.19945355, 0.80054645],[0.88713911, 0.11286089],[0.90600522, 0.09399478],[0.61741425, 0.38258575],[0.67733333, 0.32266667],[0.03826531, 0.96173469],[0.2421875 , 0.7578125 ],[0.98933333, 0.01066667],[0.92875989, 0.07124011],[0.9171123 , 0.0828877 ],[0.98387097, 0.01612903],[0.04232804, 0.95767196],[0.01041667, 0.98958333],[0.09974425, 0.90025575],[0.5127551 , 0.4872449 ],[0. , 1. ],[0.02046036, 0.97953964],[0.97474747, 0.02525253],[0.08918919, 0.91081081],[0.12144703, 0.87855297],[0.88549618, 0.11450382],[0.04557641, 0.95442359],[0.37073171, 0.62926829],[0.01355014, 0.98644986],[1. , 0. ],[0.01302083, 0.98697917],[0.01369863, 0.98630137],[0.91052632, 0.08947368],[0.9012987 , 0.0987013 ],[0.95897436, 0.04102564],[0.0188172 , 0.9811828 ],[0.05670103, 0.94329897],[0.96524064, 0.03475936],[0.11671088, 0.88328912],[0. , 1. ],[0.22955145, 0.77044855],[0.97333333, 0.02666667],[0.84594595, 0.15405405],[0.11948052, 0.88051948],[0.71621622, 0.28378378],[0.92838875, 0.07161125],[0.15860215, 0.84139785],[0.13953488, 0.86046512],[0.98982188, 0.01017812],[0. , 1. ],[0.01358696, 0.98641304],[0.01315789, 0.98684211],[0.38324873, 0.61675127],[0.85263158, 0.14736842],[0.04113111, 0.95886889],[0.9893617 , 0.0106383 ],[0.85236769, 0.14763231],[0.0025641 , 0.9974359 ],[0.76363636, 0.23636364],[0.98737374, 0.01262626],[0.00527704, 0.99472296],[0.98971722, 0.01028278],[0.06182796, 0.93817204],[0.01044386, 0.98955614],[0.11653117, 0.88346883],[0.24274406, 0.75725594],[0.8956743 , 0.1043257 ],[0.06169666, 0.93830334],[0.98694517, 0.01305483],[0.59850374, 0.40149626],[0.08080808, 0.91919192],[0.616 , 0.384 ],[0.88688946, 0.11311054],[0.00787402, 0.99212598],[0.99492386, 0.00507614],[0.01041667, 0.98958333],[0. , 1. ],[0.77114428, 0.22885572],[0. , 1. ],[0.98918919, 0.01081081],[0.10649351, 0.89350649],[0.73846154, 0.26153846],[0.13513514, 0.86486486],[0.9972973 , 0.0027027 ],[0.90104167, 0.09895833],[0.01285347, 0.98714653],[0.05540897, 0.94459103],[0.13350785, 0.86649215],[0.08695652, 0.91304348],[0. , 1. ],[0.96899225, 0.03100775],[0.84615385, 0.15384615],[0.15013405, 0.84986595],[0.93384224, 0.06615776],[0.04221636, 0.95778364],[0.61265823, 0.38734177],[0.13917526, 0.86082474],[0.95064935, 0.04935065],[0.90027701, 0.09972299],[0.00789474, 0.99210526],[0.94041451, 0.05958549],[0.8987013 , 0.1012987 ],[0. , 1. ],[0.05053191, 0.94946809],[1. , 0. ],[0.03183024, 0.96816976],[0.98963731, 0.01036269],[0.09189189, 0.90810811],[0.88235294, 0.11764706],[1. , 0. ],[0.01066667, 0.98933333],[0.0458221 , 0.9541779 ],[0.688 , 0.312 ],[0. , 1. ],[1. , 0. ],[0.67435897, 0.32564103],[0.86956522, 0.13043478],[0.99230769, 0.00769231],[0.66753927, 0.33246073],[0.47733333, 0.52266667],[0.01362398, 0.98637602],[0.82531646, 0.17468354],[0.01591512, 0.98408488],[1. , 0. ],[0.77513228, 0.22486772],[0.9871134 , 0.0128866 ],[1. , 0. ],[0.84771574, 0.15228426],[0.27720207, 0.72279793],[0.1689008 , 0.8310992 ],[0.2382199 , 0.7617801 ],[0. , 1. ],[0.75065617, 0.24934383],[0.90649351, 0.09350649],[0.05882353, 0.94117647],[1. , 0. ],[0.97837838, 0.02162162],[0.98992443, 0.01007557],[0.00507614, 0.99492386],[0.06887755, 0.93112245],[0.91282051, 0.08717949],[0.93782383, 0.06217617],[1. , 0. ],[0.24129353, 0.75870647],[0.98933333, 0.01066667],[0.13 , 0.87 ],[0.95103093, 0.04896907],[0.04522613, 0.95477387],[0.98777506, 0.01222494],[0.99479167, 0.00520833],[0.98271605, 0.01728395],[0. , 1. ],[0.93882979, 0.06117021],[0.01591512, 0.98408488],[0.06958763, 0.93041237],[0.05637255, 0.94362745],[0. , 1. ],[1. , 0. ],[0.98913043, 0.01086957],[0. , 1. ],[0.96524064, 0.03475936],[0.0802139 , 0.9197861 ],[0.9872449 , 0.0127551 ],[0.1875 , 0.8125 ],[0.0156658 , 0.9843342 ],[0.04569892, 0.95430108],[0. , 1. ],[0.81693989, 0.18306011],[0.07518797, 0.92481203],[0.1292876 , 0.8707124 ],[1. , 0. ],[0.92708333, 0.07291667],[0.22751323, 0.77248677],[0.93939394, 0.06060606],[0.0536193 , 0.9463807 ],[0.12834225, 0.87165775],[1. , 0. ],[0.92183288, 0.07816712],[0.61170213, 0.38829787],[0.86863271, 0.13136729],[1. , 0. ],[0.02150538, 0.97849462],[0.94666667, 0.05333333],[0.0298103 , 0.9701897 ],[0.13874346, 0.86125654],[0.91435768, 0.08564232],[1. , 0. ],[0.0859375 , 0.9140625 ],[0.69086022, 0.30913978]])
3. 随机森林
from sklearn.ensemble import RandomForestClassifier
rf_clf = RandomForestClassifier()
rf_clf.fit(X_train,y_train)
RandomForestClassifier()
特征重要性
- 训练完模型之后才能展示特征重要性
- sklearn中是看每个特征的平均深度:特征在不同树中的深度越靠近根节点,则越重要
- 打乱某个特征的样本顺序,看结果(误差/准确率)变化
from sklearn.datasets import load_iris
iris = load_iris()
rf_clf = RandomForestClassifier(n_estimators = 500, n_jobs=-1)
rf_clf.fit(iris['data'], iris['target'])
for name,score in zip(iris['feature_names'], rf_clf.feature_importances_):print(name, score)
sepal length (cm) 0.10755321374941752
sepal width (cm) 0.02339907592628136
petal length (cm) 0.41895084074926525
petal width (cm) 0.4500968695750358
Mnist中哪些特征比较重要呢?
- 未下载成功
from skle arn.datasets import fetch_mldata
mnist = fetch_mldata['MNIST original']rf_clf.fit(mnist['data'], mnist['target'])
rf_clf.feature_importances_.shapedef plot_digit(data):image = data.reshape (28, 28) plt.imshow(image, cmap = matplotlib.cm.hot)plt.axis ('off')plot_digit(rf_clf.feature_importances_)
char = plt.colorbar(ticks=[rf_clf.feature_importances_.min(), rf_clf.feature_importances_.max () ])
char.ax.set_yticklabels([' Not important', 'Very important' ])
---------------------------------------------------------------------------ImportError                               Traceback (most recent call last)/var/folders/hb/ryvkn_gd1xsdt_hts17mz8mc0000gn/T/ipykernel_8861/1829106262.py in <module>
----> 1 from sklearn.datasets import fetch_mldata2 mnist = fetch_mldata['MNIST original']ImportError: cannot import name 'fetch_mldata' from 'sklearn.datasets' (/Users/shangwy/opt/anaconda3/lib/python3.9/site-packages/sklearn/datasets/__init__.py)
4. Boosting-提升策略
AdaBoost
- 以SVM分类器来演示AdaBoost的基本策略
from sklearn.svm import SVC
m = len(X_train)  #一共多少样本# 随着集成策略的进行,决策边界会发生什么变化?
plt.figure(figsize=(16,5))
for subplot, learning_rate in ((121,1),(122,0.5)):sample_weights = np.ones(m)plt.subplot(subplot)for i in range(5):  svm_clf = SVC(kernel='rbf', C = 0.05, random_state = 42)svm_clf.fit(X_train,y_train,sample_weight = sample_weights)y_pred = svm_clf.p redict(X_train)sample_weights[y_pred != y_train] *= (1+learning_rate)plot_decision_boundary(svm_clf,X,y,alpha=0.2)plt.title('learning_rate ={}'.format(learning_rate))if subplot == 121:plt.text(-0.7, -0.65, '1', fontsize=14)plt.text(-0.6, -0.15, '2', fontsize=14)plt.text(-0.5, 0.10, '3', fontsize=14)plt.text(-0.4, 0.55, '4', fontsize=14)plt.text(-0.3, 0.90, '5', fontsize=14)
plt.show()

from sklearn.ensemble import AdaBoostClassifier
ada_clf = AdaBoostClassifier(DecisionTreeClassifier(max_depth=1),n_estimators = 200,learning_rate = 0.5,random_state = 42)
ada_clf.fit(X_train,y_train)
plot_decision_boundary(ada_clf,X,y)

Gradient Boosting Decision Trees
在GBDT中,每一棵决策树都是在前一棵树的残差基础上进行训练。首先,使用一个简单的初始模型(比如均值)作为预测值,计算实际值与预测值之间的残差,然后训练第一棵决策树来拟合这些残差。接着,计算当前模型对于训练样本的预测值,并将其与实际值之间的残差作为下一棵决策树的训练目标。如此重复迭代,每一轮迭代都会使模型的预测值逐渐接近真实值,从而不断改进整体的预测能力。
GBDT在训练过程中采用了梯度下降算法来最小化损失函数,通常使用平方误差或绝对误差作为损失函数。相比于普通的决策树算法,GBDT能够更好地处理非线性、高维度和大规模数据,并具有较强的泛化能力。
类似的GBDT算法:Xgboost和Lightboost
- GBDT-sklearn
- Xgboost
- Lightboost
Adaboost和Gradient Boosting都是集成学习中的重要算法,它们的目标都是通过组合多个弱学习器来构建一个更强的分类器或回归器。
下面是它们的联系和区别:
相同点
-
都是通过迭代训练多个弱分类器或回归器,并将它们组合成一个强分类器或回归器。
-
都可以用于分类和回归问题。
不同点
-
Adaboost 是一种加法模型,每一轮迭代都会将新的基分类器加入到模型中,而且每个基分类器的权重取决于前面的基分类器的分类准确率。在每一轮迭代中,Adaboost 会调整样本权重,让分类错误的样本得到更高的权重,这样可以使得后续的基分类器更关注于难以分类的样本。因此,Adaboost 可以有效地处理数据不平衡问题。
-
Gradient Boosting 是一种梯度下降模型,每一轮迭代都会训练一个新的基模型,然后将其加入到模型中,但是每个基模型的权重并不是固定的,而是根据残差的梯度来确定的。在每一轮迭代中,Gradient Boosting 会调整样本的权重,并使用残差来训练新的基模型,这样可以使得模型越来越关注于难以拟合的样本。因此,Gradient Boosting 能够有效地处理高维数据和非线性关系。
-
区别在于它们的迭代方式和损失函数。Adaboost使用加权数据样本进行迭代,每一轮迭代都调整权重以便更关注被错误分类的样本。Gradient Boosting使用前一轮模型的残差来训练下一轮模型,通过最小化残差的损失函数来逐步改进模型的预测能力。
简单来说,Adaboost通过调整样本权重来改进模型,而Gradient Boosting通过迭代地拟合残差来改进模型。
import numpy as np
np.random.seed(20)
X = np.random.rand(100,1) - 0.5
y = 3*X[:,0]**2 +0.05*np.random.randn(100)
y.shape
(100,)
from sklearn.tree import DecisionTreeRegressor
# GBDT通常的流程
# 第一个弱学习器的迭代
tree_reg1 = DecisionTreeRegressor(max_depth=2)
tree_reg1.fit(X,y)
DecisionTreeRegressor(max_depth=2)
# 第二个弱学习器的迭代
y2 = y - tree_regl.predict(X)
tree_reg2 = DecisionTreeRegressor(max_depth=1)
tree_reg2.fit(X,y2)
DecisionTreeRegressor(max_depth=1)
# 第三个弱学习器的迭代
y3 = y2 - tree_reg2.predict(X)
tree_reg3 = DecisionTreeRegressor(max_depth=2)
tree_reg3.fit(X,y3)
DecisionTreeRegressor(max_depth=2)
X_new = np.array([[0.8]])  #测试数据
y_pred = sum(tree.predict(X_new) for tree in (tree_reg1,tree_reg2,tree_reg3))
y_pred
array([0.4995486])
import numpy as np
import matplotlib.pyplot as pltdef plot_predictions(regressors, X, y, axes, label=None, style="r-", data_style="b.", data_label=None):# 生成用于预测的 x 值x1 = np.linspace(axes[0], axes[1], 500)# 对每个回归器进行预测,并将结果相加y_pred = sum(regressor.predict(x1.reshape(-1,1)) for regressor in regressors) # 绘制训练集数据点plt.plot(X[:, 0], y, data_style, label=data_label)# 绘制预测结果曲线plt.plot(x1, y_pred, style, linewidth=2, label=label)# 添加图例if label or data_label:plt.legend(loc="upper center", fontsize=16)# 设置坐标轴范围plt.axis(axes)# 创建一个图形窗口
plt.figure(figsize=(11, 11))# 第一个子图
plt.subplot(321)
plot_predictions([tree_reg1], X, y, axes=[-0.5, 0.5, -0.1, 0.8], label='$h_1(x_1)$', style="g-", data_label="Training set")
plt.ylabel('$y$', fontsize=16, rotation=0)
plt.title("Residuals and tree predictions", fontsize=16)# 第二个子图
plt.subplot(322)
plot_predictions([tree_reg1], X, y, axes=[-0.5, 0.5, -0.1, 0.8], label="$h(x_1) = h_1(x_1)$", data_label="Training set")
plt.ylabel("$y$", fontsize=16, rotation=0)
plt.title("Ensemble predictions", fontsize=16)# 第三个子图
plt.subplot(323)
plot_predictions([tree_reg2], X, y2, axes=[-0.5, 0.5, -0.5, 0.5], label="$h_2(x_1)$", style="g-", data_style="k+", data_label="Residuals")
plt.ylabel("$y-h_1(x_1)$", fontsize=16)# 第四个子图
plt.subplot(324)
plot_predictions([tree_reg1, tree_reg2], X, y, axes=[-0.5, 0.5, -0.1, 0.8], label="$h(x_1) = h_1(x_1) + h_2(x_1)$")
plt.ylabel("$y$", fontsize=16, rotation=0)# 第五个子图
plt.subplot(325)
plot_predictions([tree_reg3], X, y3, axes=[-0.5, 0.5, -0.5, 0.5], label="$h_3(x_1)$", style="g-", data_style="k+")
plt.ylabel("$y-h_1(x_1) - h_2(x_1)$", fontsize=16)
plt.xlabel("$x_1$", fontsize=16)# 第六个子图
plt.subplot(326)
plot_predictions([tree_reg1, tree_reg2, tree_reg3], X, y, axes=[-0.5, 0.5, -0.1, 0.8], label="$h(x_1) = h_1(x_1) + h_2(x_1) + h_3(x_1)$")
plt.xlabel("$x_1$", fontsize=16)
plt.ylabel("$y$", fontsize=16, rotation=0)# 显示图形
plt.show()


GBDT中的参数:实践中使用Xgboost和Lightboost
from sklearn.ensemble import GradientBoostingRegressor
# 模型1
gbdt_rgl1 = GradientBoostingRegressor(max_depth=2,n_estimators = 3,learning_rate = 1,  #树的权重random_state = 41)
gbdt_rgl1.fit(X,y)
GradientBoostingRegressor(learning_rate=1, max_depth=2, n_estimators=3,random_state=41)
# 模型2
gbdt_slow_rgl2 = GradientBoostingRegressor(max_depth=2,n_estimators = 3,learning_rate = 0.1,  #树的权重random_state = 41)
gbdt_slow_rgl2.fit(X,y)
GradientBoostingRegressor(max_depth=2, n_estimators=3, random_state=41)
#模型3
gbdt_slow_rgl3 = GradientBoostingRegressor(max_depth=2,n_estimators = 200,learning_rate = 1,  #树的权重random_state = 41)
gbdt_slow_rgl3.fit(X,y)
GradientBoostingRegressor(learning_rate=1, max_depth=2, n_estimators=200,random_state=41)
三种情况的对比:参数的作用
def plot_predictions(regressors, X, y, axes, label=None, style="r-", data_style="b.", data_label=None):# 生成用于预测的 x 值x1 = np.linspace(axes[0], axes[1], 500)# 对每个回归器进行预测,并将结果相加y_pred = sum(regressor.predict(x1.reshape(-1,1)) for regressor in regressors) # 绘制训练集数据点plt.plot(X[:, 0], y, data_style, label=data_label)# 绘制预测结果曲线plt.plot(x1, y_pred, style, linewidth=2, label=label)# 添加图例if label or data_label:plt.legend(loc="upper center", fontsize=16)# 设置坐标轴范围plt.axis(axes)# 学习率的对比
plt.figure(figsize= (12,8))
plt.subplot(221)
plot_predictions([gbdt_rgl1], X, y, axes = [-0.5,0.5,-0.1,0.8], label='Ensamble predictions')
plt.title('learning_rate={},n_estimators={}'.format(gbdt_rgl1.learning_rate,gbdt_rgl1.n_estimators))plt.subplot(222)
plot_predictions([gbdt_slow_rgl2], X, y, axes = [-0.5,0.5,-0.1,0.8], label='Ensamble predictions')
plt.title('learning_rate={},n_estimators={}'.format(gbdt_slow_rgl2.learning_rate,gbdt_slow_rgl2.n_estimators))
# 迭代轮数
plt.subplot(223)
plot_predictions([gbdt_slow_rgl3], X, y, axes = [-0.5,0.5,-0.1,0.8], label='Ensamble predictions')
plt.title('learning_rate={},n_estimators={}'.format(gbdt_slow_rgl3.learning_rate,gbdt_slow_rgl3.n_estimators))
提前停止策略
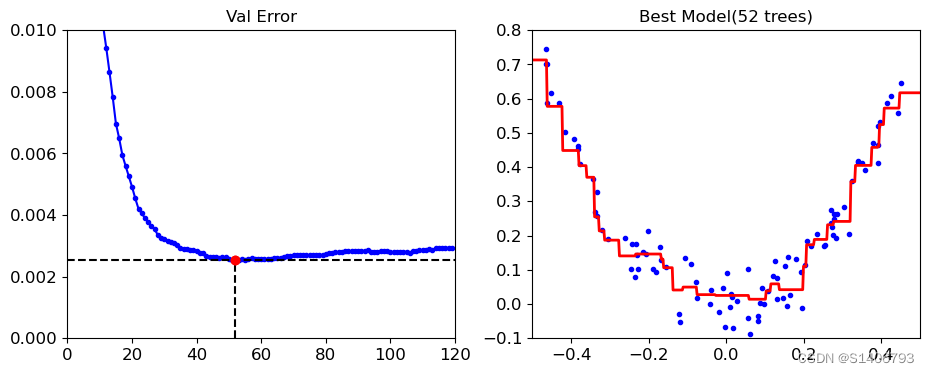
在机器学习中,提前停止策略指的是在模型训练过程中,提前终止迭代以避免过拟合和提高模型泛化能力的一种策略。
常见的提前停止策略包括两种:
固定迭代次数:在训练开始前,设定一个固定的迭代次数,当迭代次数达到预设值时,停止训练。这种方式有时不太可靠,因为不同的问题和数据集需要不同的训练时间和复杂度。
监测验证集误差:在每个迭代中,使用一个独立的验证集来估计模型的泛化误差,并监测其变化情况。当验证集误差不再下降或开始上升时,可以选择停止模型的训练,避免过拟合。在这种情况下,模型的最佳迭代次数是在验证集上得到最小误差的时刻。这种方法需要注意,因为如果不小心,可能会使模型过于依赖验证集,从而得到一个过拟合的模型。
提前停止策略可以帮助避免过拟合,提高模型的泛化能力,并减少训练时间和计算成本。
from sklearn.metrics import mean_squared_error     X_train, X_val,y_train, y_val =  train_test_split(X,y,random_state=42)
gbdt = GradientBoostingRegressor(max_depth=2,n_estimators = 120,random_state = 39)
gbdt.fit(X_train,y_train)# 计算每次迭代的验证集上的均方误差
errors = [mean_squared_error(y_val,y_pred) for y_pred in gbdt.staged_predict(X_val)]
# 找到具有最小误差的迭代次数
best_n_estimators = np.argmin(errors)# 使用最佳迭代次数初始化一个新的 GradientBoostingRegressor 模型
gbdt_best = GradientBoostingRegressor(max_depth=2,n_estimators = best_n_estimators,random_state = 42)
gbdt_best.fit(X_train,y_train)
GradientBoostingRegressor(max_depth=2, n_estimators=52, random_state=42)
min_error = np.min(errors)
min_error
0.002535247745146343
# 绘制误差变化
plt.figure(figsize=(11,4))plt.subplot(121)
plt.plot(errors,'b.-') #绘制每次迭代的验证集上的均方误差
plt.plot([best_n_estimators,best_n_estimators],[0,min_error],'k--')# 绘制最佳迭代次数
plt.plot([0,120],[min_error,min_error],'k--')# 绘制最小误差
plt.plot([best_n_estimators,best_n_estimators],[min_error,min_error],'ro')# 标记最佳迭代次数
plt.axis([0,120,0,0.01])# 设置坐标轴范围
plt.title('Val Error')# 设置子图标题plt.subplot(122)
plot_predictions([gbdt_best],X,y,axes=[-0.5,0.5,-0.1,0.8])# 绘制最佳模型的预测结果
plt.title('Best Model(%d trees)'%best_n_estimators)
Text(0.5, 1.0, 'Best Model(52 trees)')
Xgboost和Lightboost中都有一个early_stoping的参数,那么怎么实现提前停止呢?
- 但是GradientBoostingRegressor中没有,怎么在GradientBoostingRegressor中实现提前停止策略呢?
warm_start:bool, default=False
- 开启了热启动模式。热启动模式允许在模型已经训练过的基础上继续进行训练,而不是从头开始训练。这对于逐步增加模型复杂度或使用增量数据进行训练时很有用。
 gbdt = GradientBoostingRegressor(max_depth=2,random_state = 42,warm_start=True)error_going_up = 0
min_val_error = float('inf')for n_estimators in range(1,200):gbdt.n_estimators = n_estimatorsgbdt.fit(X_train,y_train)y_pred = gbdt.predict(X_val)val_error = mean_squared_error(y_val,y_pred)if val_error < min_val_error:min_val_error = val_errorerror_going_up = 0else:  #如果误差不再下降的计数达到5次(连续5次验证集误差没有下降),则停止训练,跳出循环。error_going_up +=1if error_going_up == 5:  break
print(gbdt.n_estimators)
5. Stacking(堆叠集成)
Stacking介绍





![[Python] opencv - 什么是直方图?如何绘制图像的直方图?如何对直方图进行均匀化处理?](https://img-blog.csdnimg.cn/direct/522a2286cfbb4a6c9042e6c9e2c15a6c.png)