winprop二次开发
- 前言
- 工具1——整合多个天线结果
- 用途
- 代码实现
- 未完待续
前言
工作需求,对该软件进行简单地二次开发,都是一些挺简单的代码,单纯是为了上传之后将其从本地删除
工具1——整合多个天线结果
用途
winprop最终的计算结果(必选项:接受功率,除此之外可选场强等)是以天线为单位给出热力图,如下图所示:
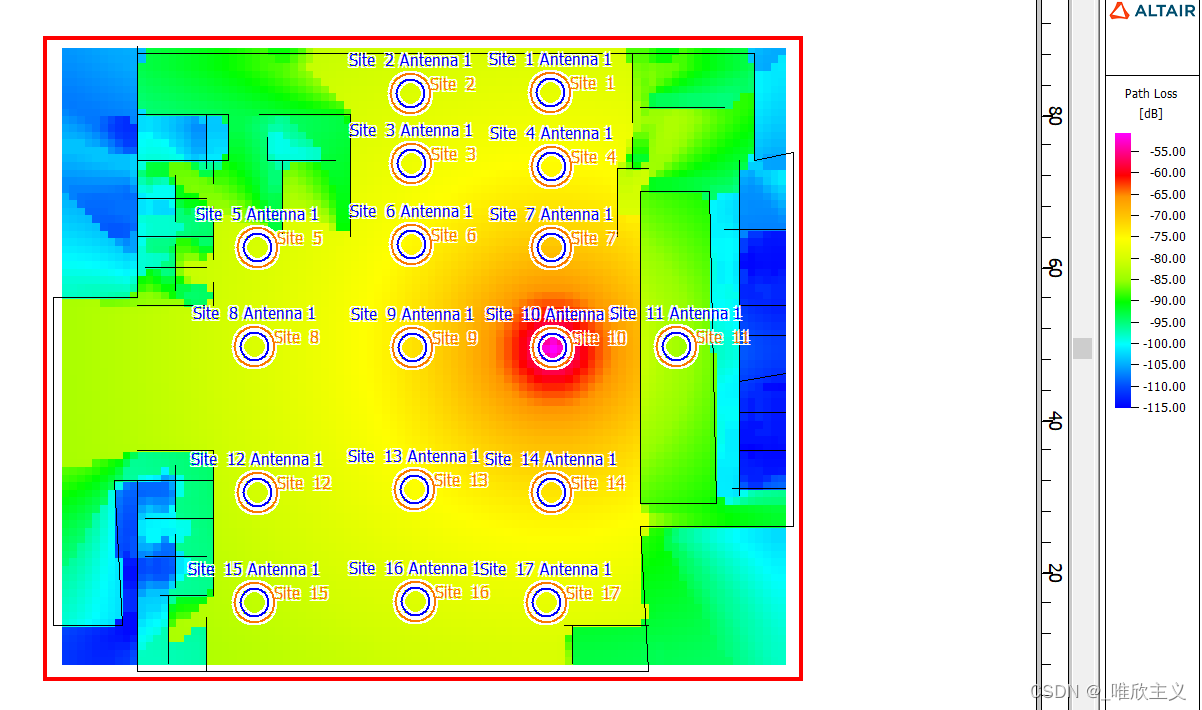
某些情况下,这种可视化的方式并不能满足我们的使用需求,比如:在一个实际项目中,我想知道我安装的两台路由器是否能够覆盖整个场景(使每个测试点位接受到的信号强度大于一定阈值),那么彼此独立的热力图并不能简洁地为你提供答案,这就是工具1的用途。
工具1中有一个关键的参数:rule,函数类型:输入是各天线在该测试点位的信号强度。在之前的场景中,我们希望的就是该点收到的信号强度中最强的那个大于阈值,所以我们的规则就是所有信号强度中取最大值。
代码实现
功能实现:
函数主体: plot_multi_heap_map
参数1:存放run结果的文件路径
参数2:规则
# ********************************************************************************************
#                                  Author: weixinzhuyi                                       #
#                                  Update: 2024-1-16                                         #
**********************************************************************************************
# a simple tool, but temporarily make up for defects that Winprop can't show us a synthetic image
# if you a better way to overcome the defect, please abandon this script immediately
import re
import os
import matplotlib.pyplot as plt
import numpy as npbase_path = 'D:/Desktop/黑龙江3D/PropName/'# structure full path
def file_name(_site_name, _antenna_name):return base_path + "Site  " + str(_site_name) + " Antenna " + str(_antenna_name) + " Power.txt"# extract information from a file with postfix "Power.txt"
def extract_pro(_file_path):test_point_pattern = re.compile(r'(\d+\.\d+)\s(\d+\.\d+)\s(-\d+\.\d+)')site_location_pattern = re.compile(r'LOCATION\s+(\d+\.\d+)\s+(\d+\.\d+)\s+(\d+\.\d+)')with open(_file_path, "r") as f:content = f.read()_test_point, test_point = re.findall(test_point_pattern, content), list()_site_location, site_location = re.findall(site_location_pattern, content), list()if _test_point:for _ in _test_point:test_point.append(list(map(float, list(_))))site_location = list(map(float, list(_site_location[0])))return site_location, test_point# a interface to plot heatmap of a certain antenna of a certain site(ap)
def plot_single_heap_map(_site_location, _test_point):x, y, power = list(zip(*_test_point))x = set(x)y = set(y)plt.imshow(np.reshape(np.array(power), (len(x), len(y))), cmap=plt.get_cmap('rainbow'))plt.tight_layout()plt.colorbar()plt.show()# get all file names which match name regex
def get_file_path(_path):# if you have a other name system, please change name regex herepattern = re.compile(r'Site\s+\d+ Antenna \d+ Power.txt')ret = list()for _ in os.listdir(_path):if re.findall(pattern, _):ret.append(_path + _)return ret# plot a new heatmap according a certain rule that you offer
# we suppose that a rule you offer a lambda function or a bulit-in function, such as max, min
def plot_multi_heap_map(_path, rule=max):# Calculationfile_dir = get_file_path(_path)site_locations, powers = list(), list()site_location, test_point = extract_pro(file_dir[0])_x, _y, power = list(zip(*test_point))site_locations.append(site_location)x = set(_x)y = set(_y)for file_path in file_dir[1:]:site_location, test_point = extract_pro(file_path)site_locations.append(site_location)_, __, power = list(zip(*test_point))powers.append(power)# Visualizationfinal = list(map(rule, list(zip(*powers))))plt.imshow(np.reshape(np.array(final), (len(x), len(y))), cmap=plt.get_cmap('rainbow'))plt.tight_layout()plt.colorbar()_site_x, _site_y, _ = list(zip(*site_locations))site_x = (np.array(_site_x) - min(x)) * len(x) / (max(x) - min(x))site_y = (np.array(_site_y) - min(y)) * len(y) / (max(y) - min(y))plt.scatter(site_y, site_x)plt.show()if __name__ == '__main__':plot_multi_heap_map(base_path, rule=lambda i: sum(i) / len(i))