如题,如何使用数据可视化库 D3 绘制折线统计图?
这篇文章将通过实例来讲解如何一步一步绘制下面这样一个折线统计图,并带有鼠标悬浮移动的文字显示效果。
首先,我们来看下什么是 d3?移步官网:https://d3js.org
D3(或D3.js)是一个用于可视化数据的免费开源JavaScript库。其基于web标准的低级别方法在创作动态、数据驱动的图形方面提供了无与伦比的灵活性。 十多年来,D3为开创性的、屡获殊荣的可视化提供了动力,成为更高级别图表库的基础构建块,并在世界各地培养了一个充满活力的数据从业者社区。
D3 它并不是一个类似于 eChart 或 AntV 等专门绘制图表的库,但我们可以利用它轻量的图形绘制能力,间接地通过一定的手段绘制出来。
其实 D3 是通过 svg 格式绘制出来的图形,在使用它的同时我们需要掌握 SVG 的一些基础知识。
安装 D3 图形库
在项目根目录下执行命令:
npm install d3 --save初始化图表组件
首先我们在组件中初始化 svg 元素,设置它的长度和宽度,类似于在一个画板中设定指定的区域作为画布,然后不断往画布中填充各种元素。
import React, { useRef } from 'react';
import * as d3 from 'd3';export default function Chart() {const width = 320;const height = 200;const svgRef = useRef();return (<svg ref={svgRef} width={width} height={height}></svg>)
}
我们准备一组用于演示的数据,它是一个对象数组,对象中包含 distance 和 elevation 的两个属性。横轴使用 distance 值用于描述距离起点的距离,纵轴使用elevation 值用于描述对应该距离所在点的海拔高度。
const data = [{ distance: 1.2, elevation: 3 },{ distance: 1.4, elevation: 3.3 },...{ distance: 4.5, elevation: 3.6 }
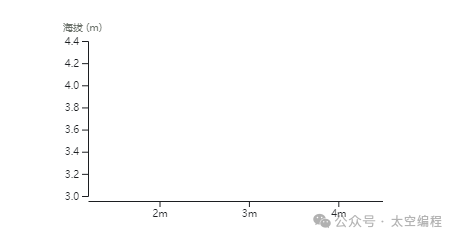
];绘制横纵坐标轴
为了让横纵坐标轴显示刻度值的时候不至于超出边界被遮挡,在四周方向上设置了外边距 margin。
import React, { useRef, useEffect } from 'react';
import * as d3 from 'd3';export default function Chart({ data }) {...useEffect(() => {const svg = d3.select(svgRef.current);// 计算比例尺const xScale = d3.scaleLinear().domain(d3.extent(data.map(d => d.distance))).range([margin.left, width - margin.right]);const yScale = d3.scaleLinear().domain(d3.extent(data.map(d => d.elevation))).range([height - margin.bottom - 5, margin.top]);const xAxis = d3.axisBottom(xScale).ticks(width / 80).tickSizeOuter(0).tickFormat(val => val + 'm');const yAxis = d3.axisLeft(yScale).ticks(height / 40);// 绘制横坐标轴svg.append('g').attr('transform', `translate(0, ${height - margin.bottom})`).call(xAxis);// 绘制纵坐标轴svg.append('g').attr('transform', `translate(${margin.left}, 0)`).call(yAxis).call(g => g.append("text").attr("x", -margin.left).attr("y", 10).attr("fill", "#6b716a").attr("text-anchor", "start").text("海拔 (m)"));}, data);...
}
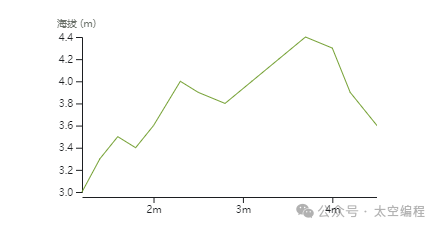
绘制数据曲线
通过 D3 的 line() 方法生成 svg 元素的 path 数据,将数据通过 datum 进行绑定后,再使用属性 stroke 和 stroke-width 设置线条的颜色和宽度。
import React, { useRef, useEffect } from 'react';
import * as d3 from 'd3';export function Chart({ data }) {...useEffect(() => {...const line = d3.line().x(d => xScale(d.distance)).y(d => yScale(d.elevation));// 绘制折线svg.append('path').datum(data).attr('class', 'line').attr('d', line).attr('fill', 'none').attr('stroke', '#75A134').attr('stroke-width', 1);}, data);...
}
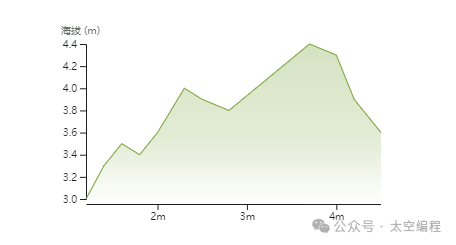
绘制渐变背景色
为了使折线图有一定的立体感和美观度,我们将折线和坐标轴围起来区域的增加一个渐变的背景色。这个区域我们可以通过 D3 的 area() 方法实现。然后将已经定义好的 线性渐变绑定到这个区域上来。
import React, { useRef, useEffect } from 'react';
import * as d3 from 'd3';export function ChartDrawArea({ data }) {...useEffect(() => {...const area = d3.area().x(d => xScale(d.distance)).y0(height - margin.bottom).y1(d => yScale(d.elevation));// 绘制渐变区域svg.append('path').datum(data).attr('d', area).attr('fill', 'url(#gradient)');}, data);return (<svg ref={svgRef} width={width} height={height}><defs><linearGradient id="gradient" x1="0" x2="0" y1="0" y2="1"><stop offset="0%" stopColor="rgba(117,161,52, 0.3)" /><stop offset="60%" stopColor="rgba(117,161,52, 0.2)" /><stop offset="100%" stopColor="rgba(117,161,52, 0)" /></linearGradient></defs></svg>)
}
绘制鼠标悬浮移动文字效果
我们在图表的上面绘制一块矩形用来监听鼠标的 mouseMove 和 mouseLeave 事件,然后触发悬浮文字的显示。
这里的难点是通过当前鼠标事件获得的位置坐标 (x, y) 计算出离得最近的数据点信息以及根据距离判断悬浮的文字显示在垂直引导线的左边还是右边。
可以看具体的代码实现,上面也有相关的注解。
import React, { useRef, useEffect, useState } from 'react';
import * as d3 from 'd3';export default function Chart({ data, width, height }) {...const clamp = (num, min, max) => Math.min(Math.max(num, min), max);const handleMouseMove = e => {const bounds = e.target.getBoundingClientRect()const posX = e.clientX ? e.clientX : clamp(e.targetTouches[0].clientX, 58, width + 32)const x = posX - bounds.left + margin.leftconst xScale = d3.scaleLinear().domain(d3.extent(data.map(d => d.distance))).range([margin.left, width - margin.right]);// 根据鼠标当前所在位置计算横坐标const distance = xScale.invert(x)// 根据当前鼠标所在横坐标的值获得最近的点const { elevation, coordinates } = data.reduce((prev, curr) =>Math.abs(curr.distance - distance) < Math.abs(prev.distance - distance) ? curr : prev,)setHoverX(x)setHoverDistance(Math.round(distance * 100) / 100)setHoverElevation(Math.floor(elevation))}const handleMouseLeave = () => {setHoverX(null)setHoverDistance(null)}function HoverText({ y, children }) {const alignToRight = hoverX > width - margin.left - margin.right - 55return (<textx={alignToRight ? -4 : 4}y={y}textAnchor={alignToRight ? 'end' : 'start'}alignmentBaseline="hanging"fill="currentColor"className='hover-text'>{children}</text>)}return (<svg className='chart' ref={svgRef} width={width} height={height}><defs><linearGradient id="gradient" x1="0" x2="0" y1="0" y2="1"><stop offset="0%" stopColor="rgba(117,161,52, 0.3)" /><stop offset="60%" stopColor="rgba(117,161,52, 0.2)" /><stop offset="100%" stopColor="rgba(117,161,52, 0)" /></linearGradient></defs>{/* 垂直引导线 */}{hoverX && (<g transform={`translate(${hoverX}, 0)`}><line y1={margin.top} y2={height - margin.bottom} stroke="currentColor" /><HoverText y={margin.top}>Dist: {hoverDistance} km</HoverText><HoverText y={margin.top + 16}>Elev: {hoverElevation} m</HoverText></g>)}{/* 悬浮效果触发区域 */}{width > 0 && height > 0 && (<rectwidth={width - margin.left - margin.right}height={height - margin.top - margin.bottom}fill="transparent"x={margin.left}y={margin.top}onMouseMove={handleMouseMove}onMouseLeave={handleMouseLeave}onTouchMove={handleMouseMove}onTouchEnd={handleMouseLeave}/>)}</svg>);
}
虽然 D3 用起来没有其它专门的图表库那么直接(只需要通过配置参数即可生成相应的图表),但是却给人一种无所不能的感觉,它只提供了笔,至于画成什么样完全取决于执笔之人。
最后,附上完整的功能代码如下:
import React, { useRef, useEffect, useState } from 'react';
import * as d3 from 'd3';export default function Chart({ data, width, height }) {const svgRef = useRef();const [hoverX, setHoverX] = useState(null)const [hoverDistance, setHoverDistance] = useState(null)const [hoverElevation, setHoverElevation] = useState(null)const margin = {top: 20,right: 0,bottom: 20,left: 25}const clamp = (num, min, max) => Math.min(Math.max(num, min), max);useEffect(() => {const svg = d3.select(svgRef.current);const xScale = d3.scaleLinear().domain(d3.extent(data.map(d => d.distance))).range([margin.left, width - margin.right]);const yScale = d3.scaleLinear().domain(d3.extent(data.map(d => d.elevation))).range([height - margin.bottom - 5, margin.top]);const line = d3.line().x(d => xScale(d.distance)).y(d => yScale(d.elevation));const area = d3.area().x(d => xScale(d.distance)).y0(height - margin.bottom).y1(d => yScale(d.elevation));const xAxis = d3.axisBottom(xScale).ticks(width / 80).tickSizeOuter(0).tickFormat(val => val + 'm');const yAxis = d3.axisLeft(yScale).ticks(height / 40);// 绘制坐标轴svg.append('g').attr('transform', `translate(0, ${height - margin.bottom})`).call(xAxis);svg.append('g').attr('transform', `translate(${margin.left}, 0)`).call(yAxis).call(g => g.append("text").attr("x", -margin.left).attr("y", 10).attr("fill", "#6b716a").attr("text-anchor", "start").text("海拔 (m)"));// 绘制折线svg.append('path').datum(data).attr('class', 'line').attr('d', line).attr('fill', 'none').attr('stroke', '#75A134').attr('stroke-width', 1);svg.append('path').datum(data).attr('d', area).attr('fill', 'url(#gradient)');}, [svgRef.current, data]);const handleMouseMove = e => {const bounds = e.target.getBoundingClientRect()const posX = e.clientX ? e.clientX : clamp(e.targetTouches[0].clientX, 58, width + 32) // TODO: measure - 58px from left screen edge, 32px from rightconst x = posX - bounds.left + margin.left// 根据鼠标当前所在位置计算横坐标const xScale = d3.scaleLinear().domain(d3.extent(data.map(d => d.distance))).range([margin.left, width - margin.right]);const distance = xScale.invert(x)// 根据当前鼠标所在横坐标的值获得最近的点const { elevation, coordinates } = data.reduce((prev, curr) =>Math.abs(curr.distance - distance) < Math.abs(prev.distance - distance) ? curr : prev,)setHoverX(x)setHoverDistance(Math.round(distance * 100) / 100)setHoverElevation(Math.floor(elevation))}const handleMouseLeave = () => {setHoverX(null)setHoverDistance(null)}function HoverText({ y, children }) {const alignToRight = hoverX > width - margin.left - margin.right - 55return (<textx={alignToRight ? -4 : 4}y={y}textAnchor={alignToRight ? 'end' : 'start'}alignmentBaseline="hanging"fill="currentColor"className='hover-text'>{children}</text>)}return (<svg className='chart' ref={svgRef} width={width} height={height}><defs><linearGradient id="gradient" x1="0" x2="0" y1="0" y2="1"><stop offset="0%" stopColor="rgba(117,161,52, 0.3)" /><stop offset="60%" stopColor="rgba(117,161,52, 0.2)" /><stop offset="100%" stopColor="rgba(117,161,52, 0)" /></linearGradient></defs>{/* 垂直引导线 */}{hoverX && (<g transform={`translate(${hoverX}, 0)`}><line y1={margin.top} y2={height - margin.bottom} stroke="currentColor" /><HoverText y={margin.top}>Dist: {hoverDistance} km</HoverText><HoverText y={margin.top + 16}>Elev: {hoverElevation} m</HoverText></g>)}{/* 悬浮效果触发区域 */}{width > 0 && height > 0 && (<rectwidth={width - margin.left - margin.right}height={height - margin.top - margin.bottom}fill="transparent"x={margin.left}y={margin.top}onMouseMove={handleMouseMove}onMouseLeave={handleMouseLeave}onTouchMove={handleMouseMove}onTouchEnd={handleMouseLeave}/>)}</svg>);
}


![[技巧]Arcgis之图斑四至点批量计算](https://img-blog.csdnimg.cn/direct/93a8290831b445a797c71ace6cf08358.png)