本次实现最终效果

技术基础以及环境要求
vue3 + echarts + 百度地图API
要求1:
VUE3 环境搭建:https://blog.csdn.net/LQ_001/article/details/136293795
要求2:
VUE3 + echatrs 环境搭建:https://blog.csdn.net/LQ_001/article/details/136308234?spm=1001.2014.3001.5502
要求3:
百度地图API申请地址:https://lbsyun.baidu.com/apiconsole/authflow/authresult
VUE3实现地图
1 百度地图API
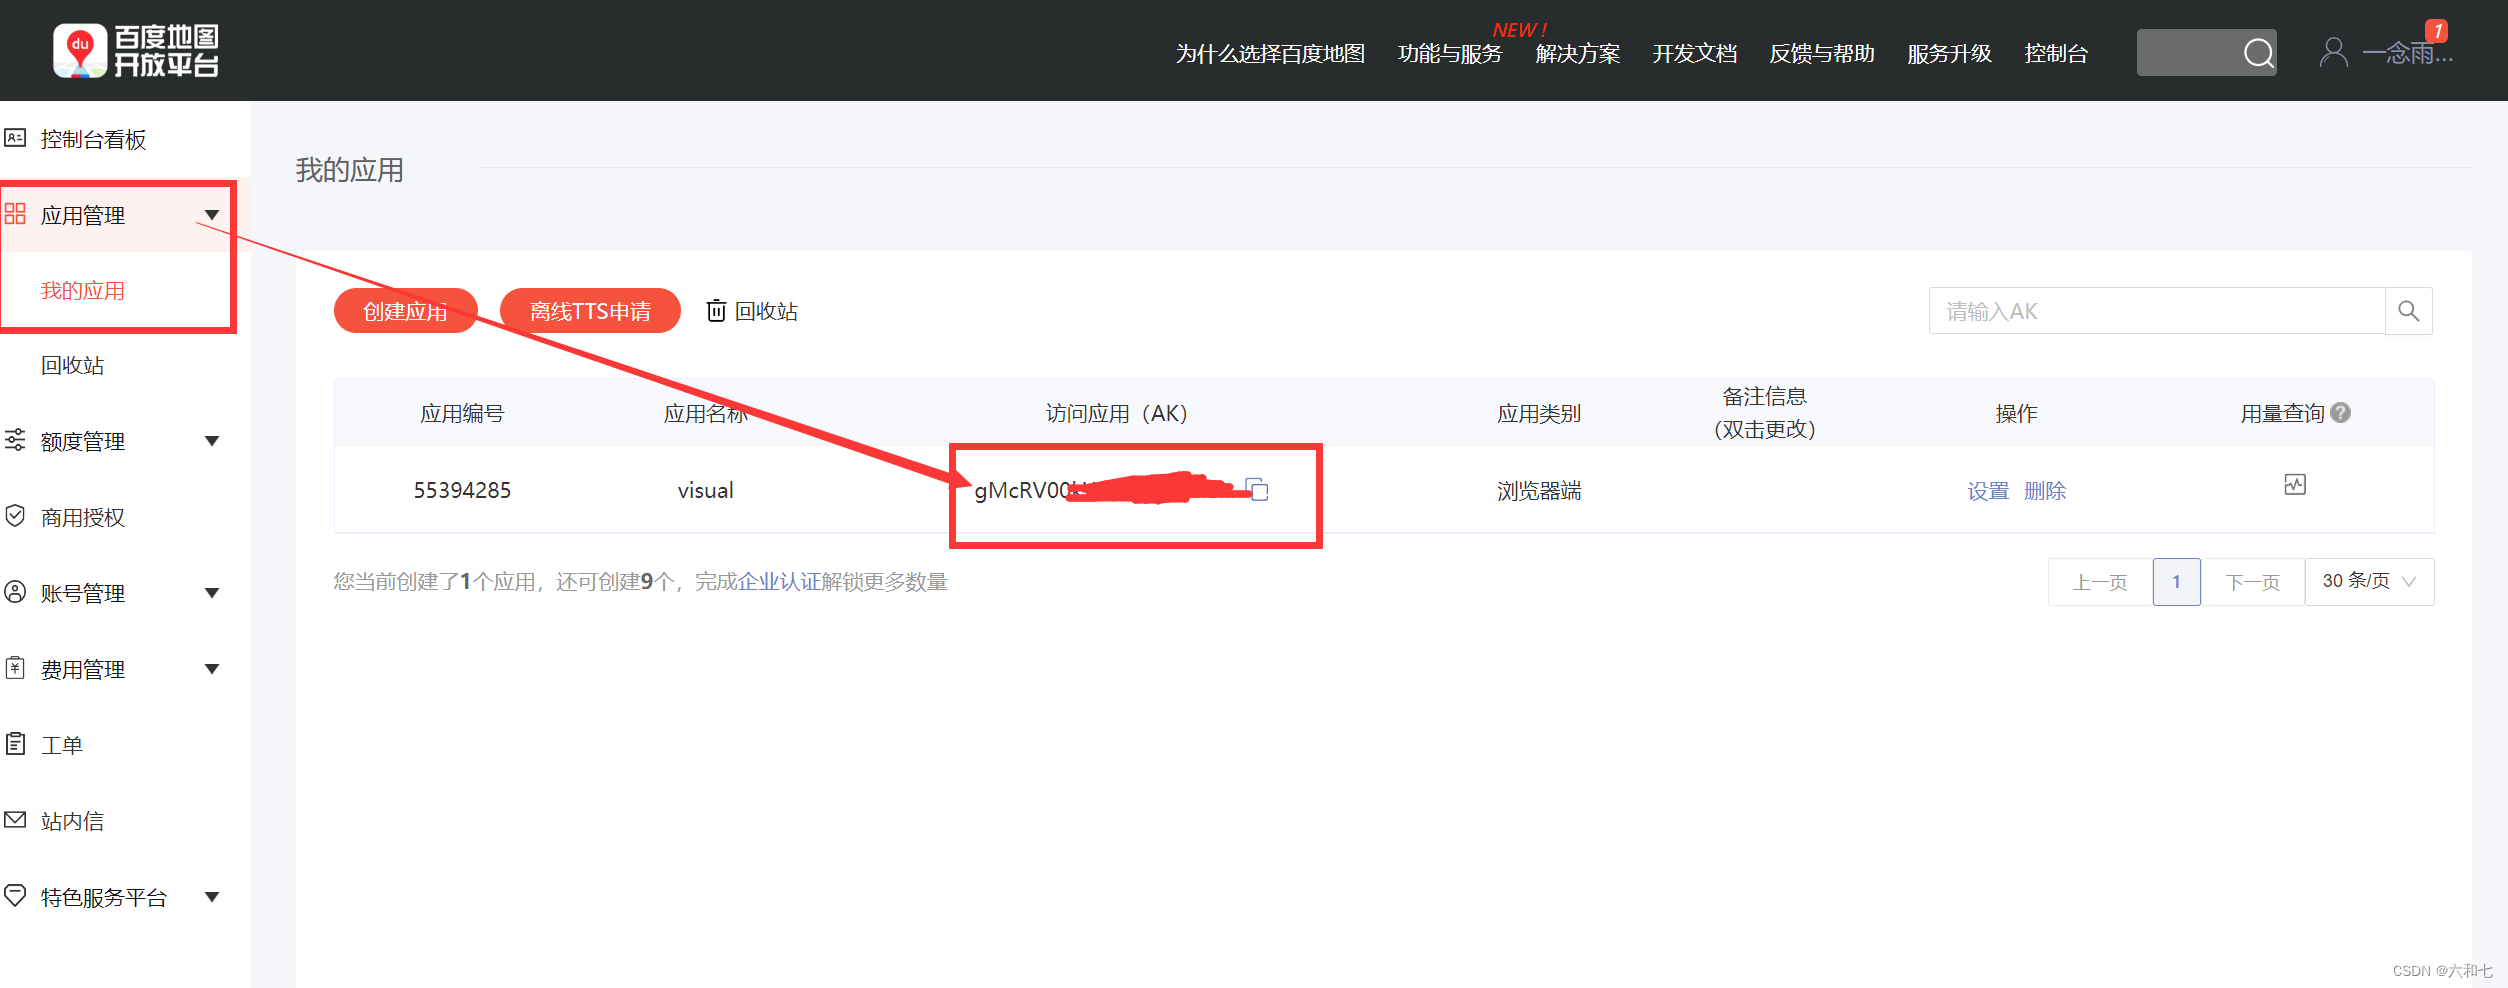
申请百度地图开发者成功以后,创建一个API。百度地图API创建过程参考这里:在vue3中如何使用百度地图API
2 VUE3代码配置项
首先,再文件 public\index.html 中,插入以下代码:
<head>。。。。。。。。。<script type="text/javascript" src="http://api.map.baidu.com/api?v=3.0&ak=API号码"></script><style type="text/css">.BMap_cpyCtrl {display: none;}</style><style type="text/css">.anchorBL{display:none;}</style>
</head>
上面代码,第一句是加 API的,第二三句是消除百度地图水印的。百度水印如下图:

import 'echarts/extension/bmap/bmap';
3 VUE3 引入 echarts 地图代码
新建一个 VUE3 布局文件模板,VUE3 代码如下:
<template><div ref="myChart" id="mychart"></div>
</template><script>
import * as echarts from 'echarts';
export default {name: 'MyChart',mounted() {let myChart = echarts.init(this.$refs.myChart,'dark');let option = {};myChart.setOption(option);},
};
</script><style>
#mychart {width: 500px;height: 500px;border: 4px solid #89a2f5;
}
</style>
打开 echarts 地图样式代码,本例子使用echarts PM2.5例子,如图:
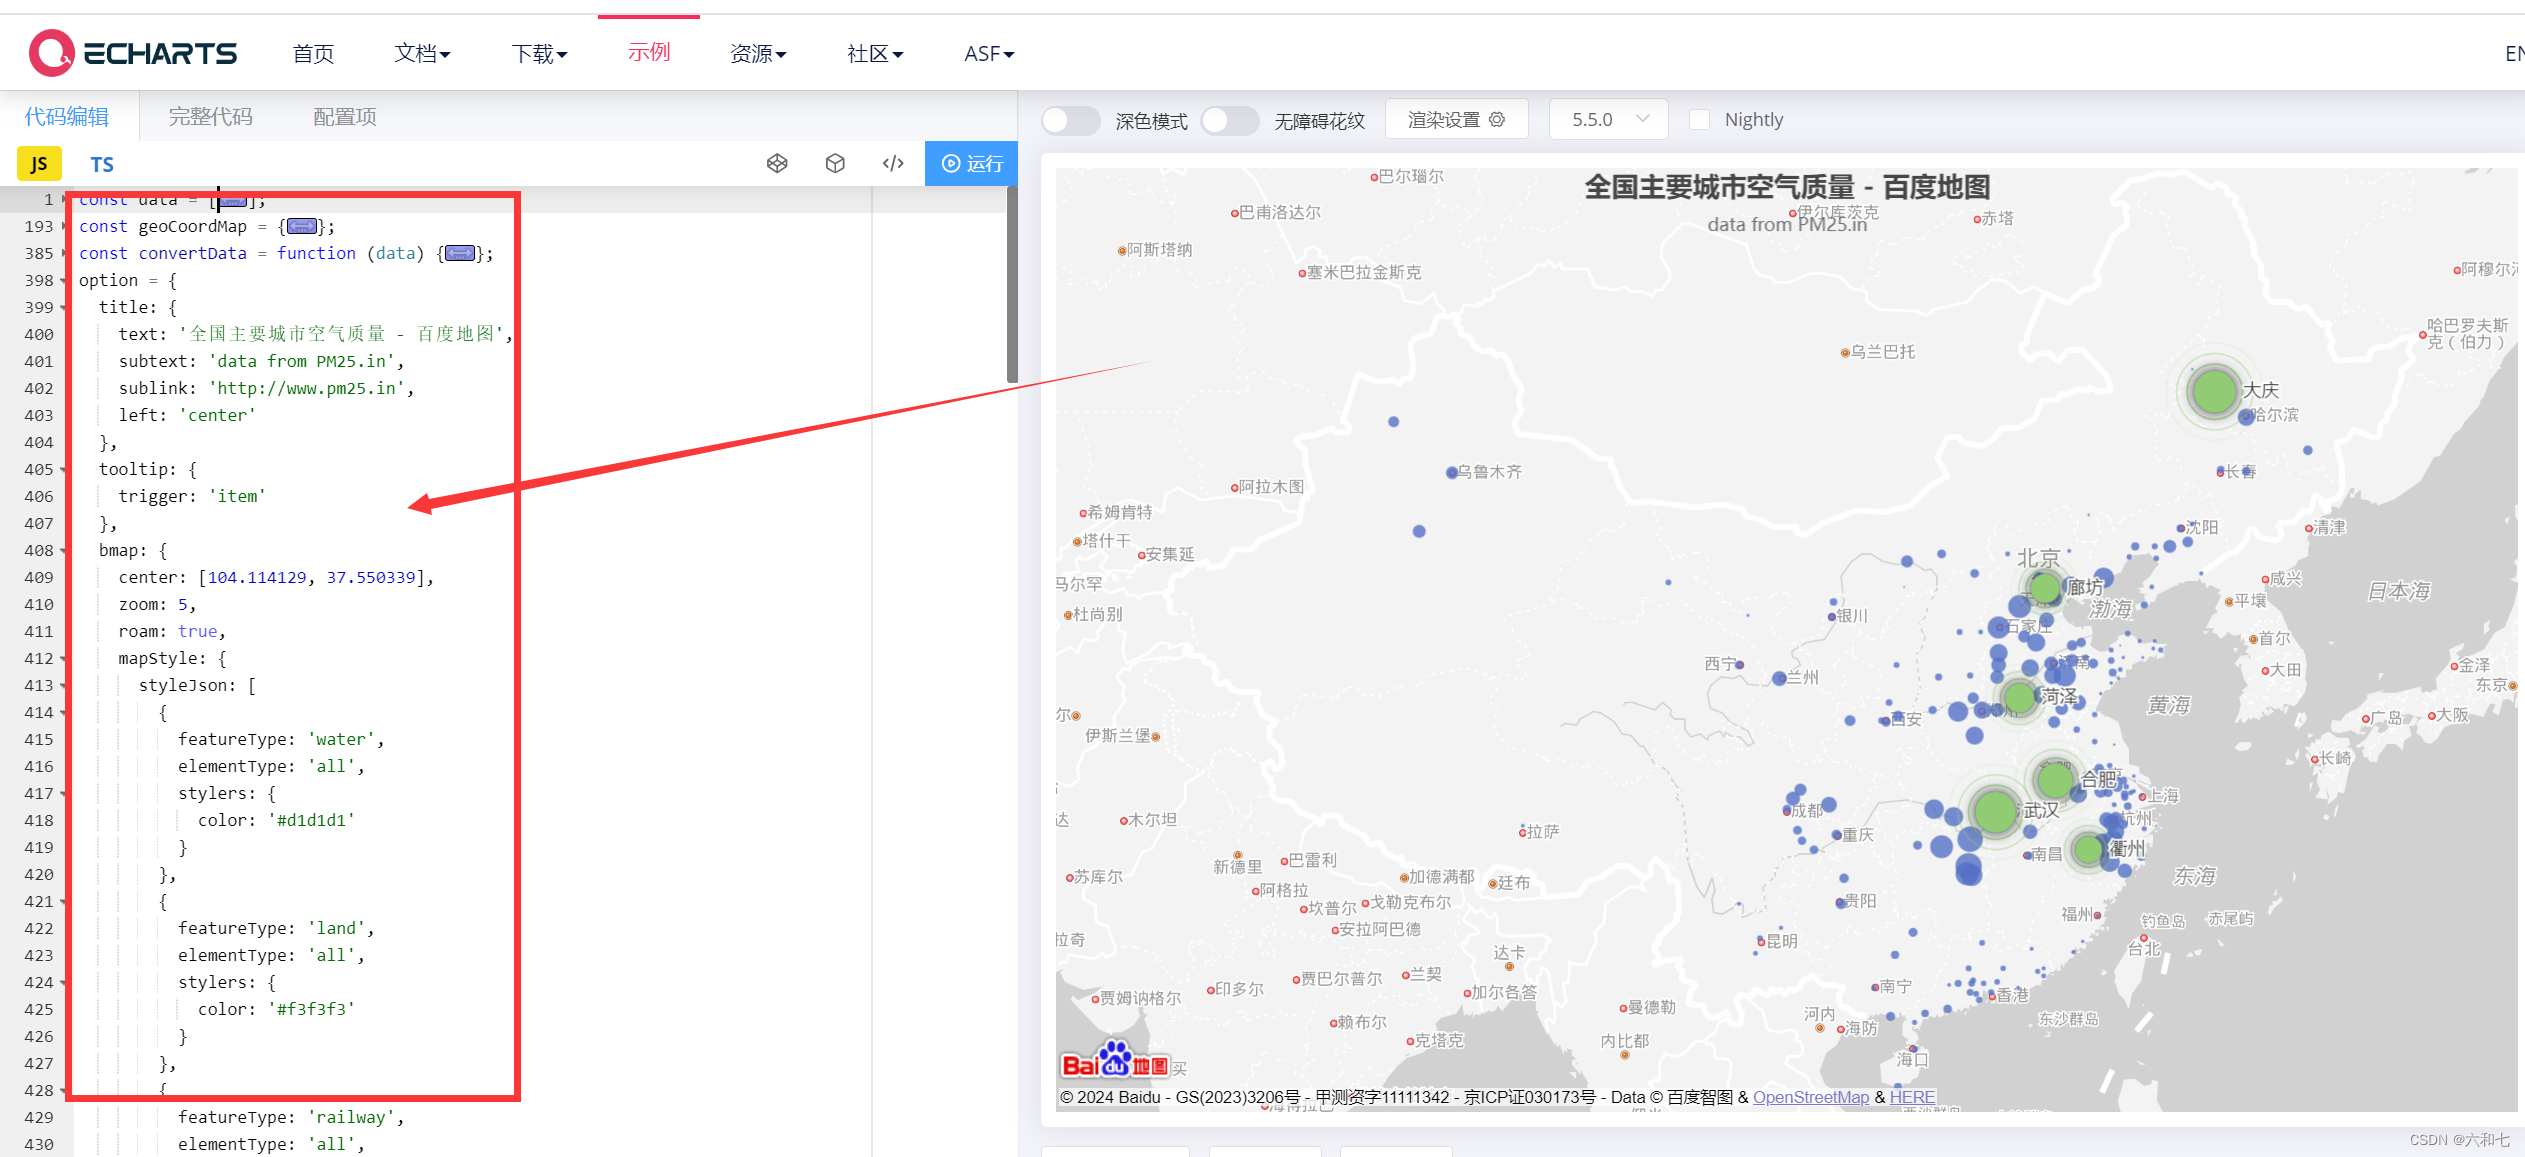
将 echarts 左边的代码,按照如下拷贝进来:
<template><div ref="myChart" id="mychart"></div>
</template><script>
import * as echarts from 'echarts';
export default {name: 'MyChart',mounted() {let myChart = echarts.init(this.$refs.myChart,'dark');const data = [拷贝]const geoCoordMap = {拷贝}let option = { 拷贝};myChart.setOption(option);},
};
</script><style>
#mychart {width: 500px;height: 500px;border: 4px solid #89a2f5;
}
</style>
不出意外,将上面三处拷贝进来就能显示地图了。
