失踪人口回归,本篇来介绍下R语言读取大型NetCDF文件的一些实践。
1 NetCDF数据简介
先给一段Wiki上关于NetCDF的定义。
NetCDF (Network Common Data Form) is a set of software libraries and self-describing, machine-independent data formats that support the creation, access, and sharing of array-oriented scientific data. The project homepage is hosted by the Unidata program at the University Corporation for Atmospheric Research (UCAR). They are also the chief source of netCDF software, standards development, updates, etc. The format is an open standard. NetCDF Classic and 64-bit Offset Format are an international standard of the Open Geospatial Consortium.The project started in 1988 and is still actively supported by UCAR. The original netCDF binary format (released in 1990, now known as "netCDF classic format") is still widely used across the world and continues to be fully supported in all netCDF releases. Version 4.0 (released in 2008) allowed the use of the HDF5 data file format. Version 4.1 (2010) added support for C and Fortran client access to specified subsets of remote data via OPeNDAP. Version 4.3.0 (2012) added a CMake build system for Windows builds. Version 4.7.0 (2019) added support for reading Amazon S3 objects. Further releases are planned to improve performance, add features, and fix bugs.
本质上NetCDF是一个多维矩阵的数据,常用于地球科学领域的数据存储。
wiki百科定义
给出一个典型的例子(CHAP的O3数据)。

2 R语言处理大型NetCDF文件
我们可以看到NetCDF本质上这就是多个栅格叠在一起的文件,在R里面的处理方式基本依赖于几个栅格和NetCDF相关的包。包括ncdf4, raster/terra。
install.packages('ncdf4')
install.packages('raster')
install.packages('terra')
接下来给出一个标准的读nc文件的代码。
#读取文件
nc_o3 <- nc_open('CHAP_O3_Y10K_2013_V1.nc')#显示文件内容
print(nc_o3)#获取经纬度,变量名与缺失值
long <- ncvar_get(nc_o3, 'lon')
lat <- ncvar_get(nc_o3, 'lat')
o3 <- ncvar_get(nc_o3, 'O3')
fillvalue <- ncatt_get(nc_o3, "O3", "fill_value")
o3[o3==fillvalue$value] <- NA#生成栅格
r <- raster(t(o3), xmn=min(long), xmx=max(long), ymn=min(lat), ymx=max(lat), crs=CRS("+proj=longlat +datum=WGS84 +no_defs"))#绘图
plot(r)
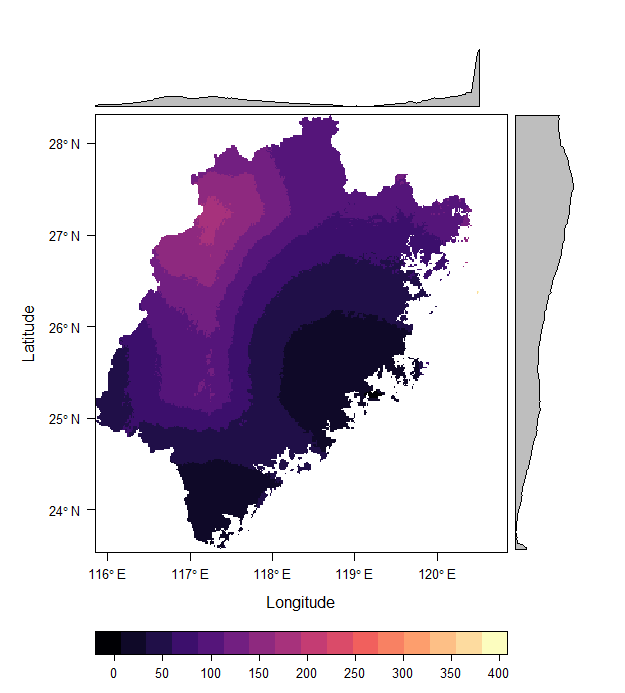
这部分代码的运行结果就是第一部分显示的那张图。这里要注意的是,print(nc_o3)那句代码是会决定下面获取经纬度,变量名与缺失名的关键。如图所示,这里的变量数量是一个,就是臭氧浓度O3,单位是 μ g / m 3 \mu g/m^3 μg/m3,变量名叫o3,缺失值为-999,然后对应的经纬度名字是lat和lon。

由于这个数据是10 km的处理起来比较快。当遇到全球或者全国比较精细化的NetCDF文件的时候,读取和另存为栅格可能会非常耗内存,因为R语言在处理数据的时候,默认是把数据全部读进去内存。笔者最近处理了一个全国km级的逐月气象数据。当我加载某一个三年的数据时,忽然内存飙升了,存进去的多维矩阵能占据5.7G内存。因此这就对处理速度和机子要求很高,也会有很多麻烦。那么当然我并不需要全国的数据,实际上我也是裁出研究区的数据。因此做了一下搜索和实践,总结了下如何根据需求,只读取部分区域的大型NetCDF文件。这样子就不需要机子内存的高要求了,这里以福建省为例(福建省的shp数据可以参照如下的链接下载)。使用的NetCDF数据为国家青藏高原科学数据中心1901到2022年逐月1km降水数据。
福建省标准地图矢量数据首次公开发布
中国1km分辨率逐月降水量数据集(1901-2022)
中国1km分辨率逐月平均气温数据集(1901-2022)
主要的代码如下:
#install.packages('sf')
#install.packages('raster')
#install.packages('terra')
#install.packages('ncdf4')
#install.packages('rasterVis')
#Load library
library(sf)
library(ncdf4)
library(raster)
library(terra)
library(rasterVis)#Read shapefile
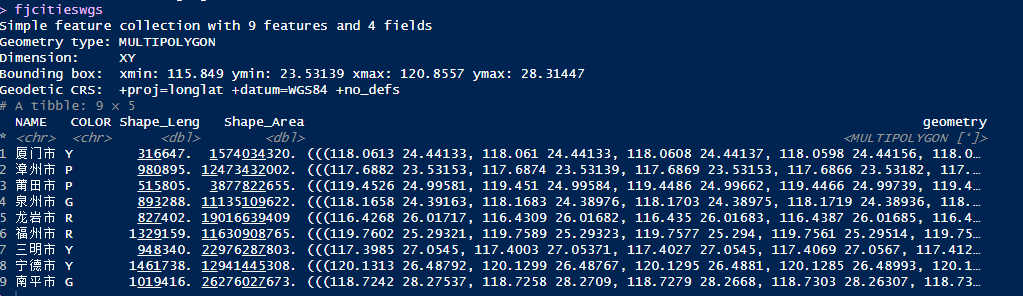
fjcities <- read_sf('city.shp')
fjcitieswgs <- st_transform(fjcities, crs = '+proj=longlat +datum=WGS84 +no_defs')#Read netcdf file
nc_pre <- nc_open('pre_2021.nc')#Display the information of NetCDF
print(nc_pre)fjcitieswgs#To obtain the longitude, latitude, time, and name of variable
long <- ncvar_get(nc_pre, 'lon')
lat <- ncvar_get(nc_pre, 'lat')#Calculate numbers of rows and columns of the specific study area
LonIdx <- which(long[] > 115 & long[] < 121)
LatIdx <- which(lat[] > 23 & lat[] < 29)pre <- ncvar_get(nc_pre, 'pre', start = c(LonIdx[1], LatIdx[1],1),count = c(length(LonIdx), length(LatIdx),1))
fillvalue <- ncatt_get(nc_pre, "pre", "missing_value")
pre[pre==fillvalue$value] <- NA#To generate raster
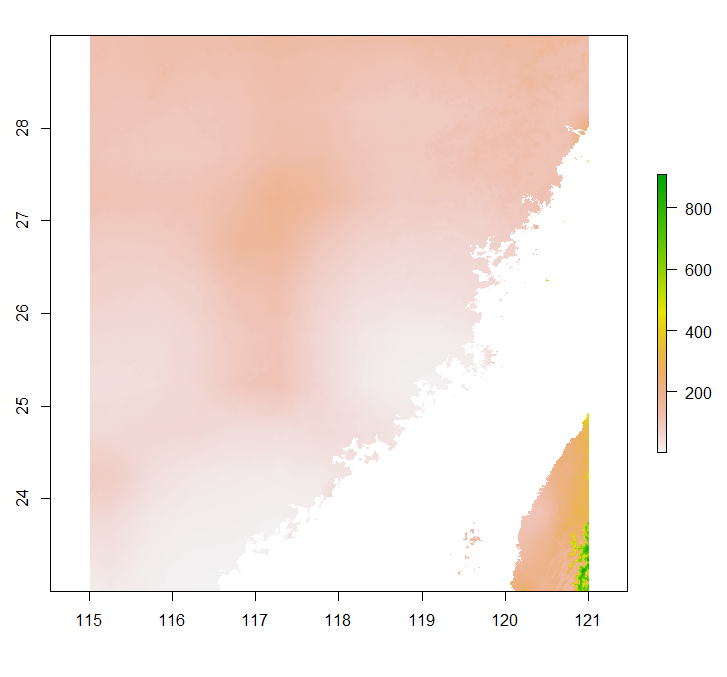
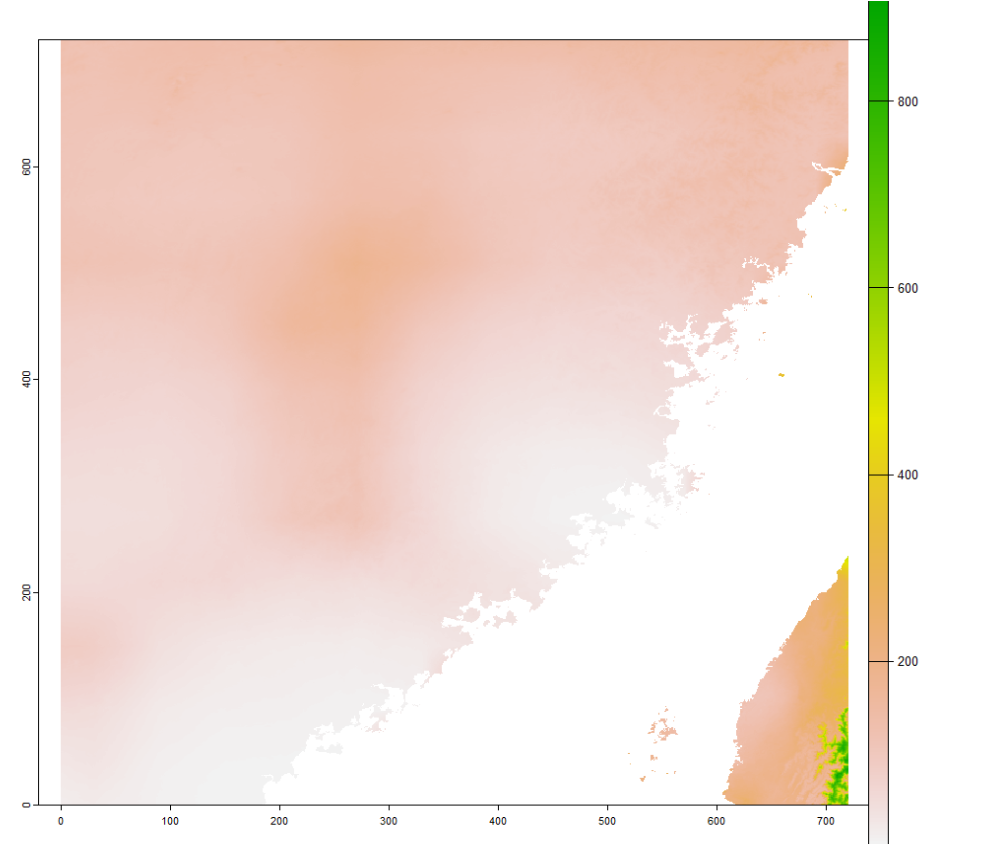
r <- raster(t(pre), xmn=min(long[LonIdx]), xmx=max(long[LonIdx]), ymn=min(lat[LatIdx]), ymx=max(lat[LatIdx]), crs=CRS("+proj=longlat +datum=WGS84 +no_defs"))#Display the raster
plot(r)#Clip the raster using the shapefile
r <- crop(r, fjcitieswgs)
r <- mask(r, fjcitieswgs)#Display the raster
plot(r)#Using different r package to plot raster
levelplot(r)
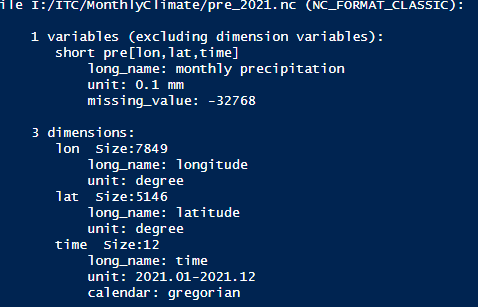

关键在于ncvar_get函数里的start和count参数。这两个负责控制读取NC的行列数据以及多维数(如果没有时间轴,直接给一个2个元素的数组就行)。start是读取NetCDF的起始行列数,count是读取NetCDF的数量。后续转栅格的操作是raster函数的写法。由于raster快停止维护了。我们也会提供terra包的写法(实际上差别不大)。
#Use terra pacakge to generate raster
rn <- rast(t(pre), crs= '+proj=longlat +datum=WGS84 +no_defs')#Display the raster
plot(rn)
由于后续的裁剪代码terra和raster毫无差别。这里就不赘述了。这部分代码我也会放在我的Github项目上(My Studies of Urban GIS)。
最后感谢下Google搜到的几个资料。
参考链接:
-
Read multiple layers raster from ncdf file using terra package
-
extracting large layer netcdf using r
-
How to reduce the size of a NetCDF in R?
-
Extracting a large layer from NetCDF using R


![[百度二面]操作系统进程、锁相关面试题](https://img-blog.csdnimg.cn/img_convert/a62927c4c7cae42a7e5647a29c37d993.png)