前言
本文采用 MySQL 沙盒实例作为测试目标,使用 sysbench-1.20 对其做 OLTP 基准测试。
有关 MySQL 沙盒的更多信息,请参阅 玩转 MySQL Shell 沙盒实例,【MySQL Shell】6.8 AdminAPI MySQL 沙盒 。
1、部署一个 MySQL 沙盒实例
使用 mysqlsh 部署一个 MySQL 沙盒实例用于测试 OLTP 。
 MySQL  JS > dba.deploySandboxInstance(3310);
A new MySQL sandbox instance will be created on this host in
/root/mysql-sandboxes/3310Warning: Sandbox instances are only suitable for deploying and
running on your local machine for testing purposes and are not
accessible from external networks.Please enter a MySQL root password for the new instance: ********Deploying new MySQL instance...Instance localhost:3310 successfully deployed and started.
Use shell.connect('root@localhost:3310') to connect to the instance.
2、创建 sysbench oltp 测试的基础配置文件
为什么要使用配置文件?方便快捷啊!配置文件可以简化操作,省着在命令行中指定这些参数时至少还要多打 -- 和空格。如果一些参数可以复用,建议创建一个配置文件。
$ cat mysql-sb.cnf
threads=2
time=600db-driver=mysql
mysql-host=localhost
mysql-port=3310
mysql-socket=/root/mysql-sandboxes/3310/sandboxdata/mysqld.sock
mysql-user=root
mysql-password=Ro123ot$
mysql-db=sbtest
在创建时读者可能遇到一个问题,在配置文件中指定诸如 tables 选项时不生效,并且会报 Unknown argument type: 0 。而在命令行中指定时则有效。原因是什么呢?
因为这个参数是 Lua 脚本的参数,而不是 sysbench 这个二进制可执行文件的参数!
所以应该在命令行中使用诸如 --tables=N 这样的 Lua 脚本参数来测试。
3、准备测试数据
笔者准备了 100 个包含 10000 行数据的测试表,库名和表名都是用默认值。
$ sysbench --config-file=mysql-sb.cnf --tables=100 oltp_common prepare
注意此阶段的屏幕打印信息,多线程时可能出现争用,导致部分表未创建成功,或写入的数据不全。
sbtest6 创建失败报错:
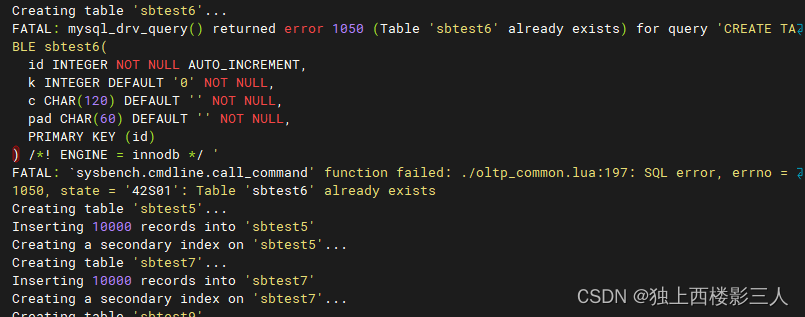
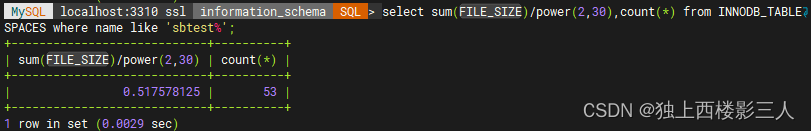
计划创建 100 张表,实际只创建了 53 个,上面的 sbtest6 表虽然最后创建成功了,但插入的数据不全。

4、运行测试
1) oltp_read_write
建议先对支持 prewarm 选项的 Lua 脚本使用 prewarm 选项,以预热数据到内存,提高性能。
$ sysbench --config-file=mysql-sb.cnf --tables=100 oltp_read_write.lua prewarm
因输出过长,以下仅截取部分信息。
预热后:
$ sysbench --config-file=mysql-sb.cnf --tables=100 oltp_read_write.lua run
sysbench 1.0.20 (using bundled LuaJIT 2.1.0-beta2)Running the test with following options:
Number of threads: 2
Initializing random number generator from current timeInitializing worker threads...Threads started!SQL statistics:queries performed:read:                            2272046write:                           530149other:                           443585total:                           3245780transactions:                        162289 (270.47 per sec.)queries:                             3245780 (5409.35 per sec.)ignored errors:                      0      (0.00 per sec.)reconnects:                          0      (0.00 per sec.)General statistics:total time:                          600.0289stotal number of events:              162289Latency (ms):min:                                    4.40avg:                                    7.39max:                                  427.6895th percentile:                       10.09sum:                              1199185.78Threads fairness:events (avg/stddev):           81144.5000/31.50execution time (avg/stddev):   599.5929/0.00
未预热,同时使用周期报告来每 5 秒生成一次报告信息:
$ sysbench --config-file=mysql-sb.cnf --tables=100 oltp_read_write run --report-interval=5
sysbench 1.0.20 (using bundled LuaJIT 2.1.0-beta2)Running the test with following options:
Number of threads: 2
Report intermediate results every 5 second(s)
Initializing random number generator from current timeInitializing worker threads...Threads started![ 5s ] thds: 2 tps: 137.01 qps: 2747.56 (r/w/o: 1923.71/549.43/274.42) lat (ms,95%): 23.52 err/s: 0.00 reconn/s: 0.00
[ 10s ] thds: 2 tps: 199.67 qps: 3993.69 (r/w/o: 2795.44/798.90/399.35) lat (ms,95%): 14.73 err/s: 0.00 reconn/s: 0.00
[ 15s ] thds: 2 tps: 204.00 qps: 4080.05 (r/w/o: 2856.03/816.01/408.00) lat (ms,95%): 12.52 err/s: 0.00 reconn/s: 0.00
...
[ 590s ] thds: 2 tps: 285.00 qps: 5698.37 (r/w/o: 3989.18/1139.19/570.00) lat (ms,95%): 9.06 err/s: 0.00 reconn/s: 0.00
[ 595s ] thds: 2 tps: 285.80 qps: 5714.78 (r/w/o: 3999.39/1144.00/571.40) lat (ms,95%): 9.06 err/s: 0.00 reconn/s: 0.00
[ 600s ] thds: 2 tps: 281.97 qps: 5641.39 (r/w/o: 3949.97/1127.28/564.14) lat (ms,95%): 9.22 err/s: 0.00 reconn/s: 0.00
SQL statistics:queries performed:read:                            2126824write:                           607664other:                           303832total:                           3038320transactions:                        151916 (253.18 per sec.)queries:                             3038320 (5063.66 per sec.)ignored errors:                      0      (0.00 per sec.)reconnects:                          0      (0.00 per sec.)General statistics:total time:                          600.0218stotal number of events:              151916Latency (ms):min:                                    4.70avg:                                    7.89max:                                 1579.2395th percentile:                        9.91sum:                              1199355.27Threads fairness:events (avg/stddev):           75958.0000/101.00execution time (avg/stddev):   599.6776/0.00
2) oltp_point_select.lua
注意,
.lua后缀加不加都行。
$ sysbench --config-file=mysql-sb.cnf --tables=100 oltp_point_select.lua run
sysbench 1.0.20 (using bundled LuaJIT 2.1.0-beta2)Running the test with following options:
Number of threads: 2
Report intermediate results every 5 second(s)
Initializing random number generator from current timeInitializing worker threads...Threads started!
[ 5s ] thds: 2 tps: 13309.18 qps: 13309.18 (r/w/o: 13309.18/0.00/0.00) lat (ms,95%): 0.21 err/s: 0.00 reconn/s: 0.00
[ 10s ] thds: 2 tps: 12990.77 qps: 12990.77 (r/w/o: 12990.77/0.00/0.00) lat (ms,95%): 0.22 err/s: 0.00 reconn/s: 0.00
[ 15s ] thds: 2 tps: 13777.54 qps: 13777.54 (r/w/o: 13777.54/0.00/0.00) lat (ms,95%): 0.20 err/s: 0.00 reconn/s: 0.00
...
[ 590s ] thds: 2 tps: 13479.94 qps: 13479.94 (r/w/o: 13479.94/0.00/0.00) lat (ms,95%): 0.20 err/s: 0.00 reconn/s: 0.00
[ 595s ] thds: 2 tps: 13402.69 qps: 13402.69 (r/w/o: 13402.69/0.00/0.00) lat (ms,95%): 0.20 err/s: 0.00 reconn/s: 0.00
[ 600s ] thds: 2 tps: 13573.04 qps: 13573.04 (r/w/o: 13573.04/0.00/0.00) lat (ms,95%): 0.20 err/s: 0.00 reconn/s: 0.00
SQL statistics:queries performed:read:                            8165259write:                           0other:                           0total:                           8165259transactions:                        8165259 (13608.60 per sec.)queries:                             8165259 (13608.60 per sec.)ignored errors:                      0      (0.00 per sec.)reconnects:                          0      (0.00 per sec.)General statistics:total time:                          600.0052stotal number of events:              8165259Latency (ms):min:                                    0.12avg:                                    0.15max:                                   48.5195th percentile:                        0.20sum:                              1189126.95Threads fairness:events (avg/stddev):           4082629.5000/4029.50execution time (avg/stddev):   594.5635/0.01
3) oltp_write_only.lua
上面设置的 report-interval 每 5 秒报告一次太频繁了,笔者目的是为了演示 sysbench 的用法,因而选择后面不再报告了。
此外,这个测试我在命令行增加了开启直方图的参数 --histogram=on ,来看一下效果吧!
$ sysbench --config-file=mysql-sb.cnf --tables=100 oltp_write_only.lua run --histogram=on
sysbench 1.0.20 (using bundled LuaJIT 2.1.0-beta2)Running the test with following options:
Number of threads: 2
Initializing random number generator from current timeInitializing worker threads...Threads started!Latency histogram (values are in milliseconds)value  ------------- distribution ------------- count1.759 |                                         11.824 |                                         11.857 |                                         51.891 |                                         111.925 |                                         221.960 |                                         691.996 |                                         1492.032 |                                         2012.069 |*                                        3352.106 |*                                        5572.145 |**                                       9472.184 |***                                      13272.223 |****                                     18962.264 |*****                                    26082.305 |*******                                  35782.347 |**********                               46872.389 |*************                            60722.433 |****************                         78442.477 |********************                     98562.522 |************************                 113442.568 |**************************               124412.615 |*****************************            137622.662 |*******************************          150342.710 |**********************************       165142.760 |*************************************    177352.810 |**************************************** 191852.861 |**************************************** 192582.913 |***************************************  189972.966 |**************************************   184093.020 |***********************************      170693.075 |*********************************        156893.130 |*******************************          148643.187 |****************************             136473.245 |**************************               123693.304 |***********************                  110863.364 |********************                     98583.425 |******************                       86803.488 |****************                         77863.551 |**************                           67743.615 |************                             56333.681 |**********                               48283.748 |********                                 39913.816 |*******                                  34283.885 |******                                   28533.956 |*****                                    23604.028 |****                                     19484.101 |***                                      16484.176 |***                                      13464.252 |**                                       10824.329 |**                                       10054.407 |**                                       7964.487 |*                                        6794.569 |*                                        6294.652 |*                                        5484.737 |*                                        4734.823 |*                                        4984.910 |*                                        4534.999 |*                                        4625.090 |*                                        4565.183 |*                                        4485.277 |*                                        4585.373 |*                                        4995.470 |*                                        4785.570 |*                                        5175.671 |*                                        4815.774 |*                                        5445.879 |*                                        5615.986 |*                                        5466.095 |*                                        5686.205 |*                                        5496.318 |*                                        5706.433 |*                                        5296.550 |*                                        5756.669 |*                                        4966.790 |*                                        4636.913 |*                                        4517.039 |*                                        4187.167 |*                                        4077.297 |*                                        3557.430 |*                                        3537.565 |*                                        3087.702 |*                                        2667.842 |*                                        259SQL statistics:queries performed:read:                            0write:                           1480184other:                           740092total:                           2220276transactions:                        370046 (616.73 per sec.)queries:                             2220276 (3700.37 per sec.)ignored errors:                      0      (0.00 per sec.)reconnects:                          0      (0.00 per sec.)General statistics:total time:                          600.0123stotal number of events:              370046Latency (ms):min:                                    1.76avg:                                    3.24max:                                 1266.8095th percentile:                        4.41sum:                              1198670.01Threads fairness:events (avg/stddev):           185023.0000/8.00execution time (avg/stddev):   599.3350/0.00
输出信息也太长了,以上仅截取重要的直方图部分。
4) oltp_delete.lua
$ sysbench --config-file=mysql-sb.cnf --tables=100 oltp_delete.lua run
sysbench 1.0.20 (using bundled LuaJIT 2.1.0-beta2)Running the test with following options:
Number of threads: 2
Initializing random number generator from current timeInitializing worker threads...Threads started!SQL statistics:queries performed:read:                            0write:                           312795other:                           3073107total:                           3385902transactions:                        3385902 (5643.06 per sec.)queries:                             3385902 (5643.06 per sec.)ignored errors:                      0      (0.00 per sec.)reconnects:                          0      (0.00 per sec.)General statistics:total time:                          600.0094stotal number of events:              3385902Latency (ms):min:                                    0.11avg:                                    0.35max:                                  774.4995th percentile:                        1.58sum:                              1194234.55Threads fairness:events (avg/stddev):           1692951.0000/195.00execution time (avg/stddev):   597.1173/0.01
5) oltp_insert.lua
$ sysbench --config-file=mysql-sb.cnf --tables=100 oltp_insert.lua run --histogram=on
sysbench 1.0.20 (using bundled LuaJIT 2.1.0-beta2)Running the test with following options:
Number of threads: 2
Initializing random number generator from current timeInitializing worker threads...Threads started!Latency histogram (values are in milliseconds)value  ------------- distribution ------------- count0.872 |                                         10.888 |                                         30.904 |                                         70.920 |                                         120.937 |                                         430.954 |                                         730.971 |                                         1860.989 |                                         3591.007 |*                                        5481.025 |*                                        6401.044 |*                                        8291.063 |*                                        12771.082 |***                                      22891.102 |****                                     36041.122 |******                                   49841.142 |*******                                  60731.163 |*********                                74631.184 |**********                               88191.205 |***********                              95591.227 |*************                            107511.250 |***************                          128631.272 |*******************                      159821.295 |**********************                   191221.319 |*************************                215231.343 |**************************               226171.367 |*****************************            249221.392 |**********************************       293201.417 |**************************************   322891.443 |**************************************   327921.469 |***************************************  335211.496 |**************************************** 343241.523 |**************************************   329751.551 |***************************************  331221.579 |**************************************   329071.608 |*************************************    319561.637 |************************************     309091.667 |**********************************       292391.697 |********************************         273151.728 |*****************************            252751.759 |**************************               223481.791 |**********************                   188241.824 |*******************                      161521.857 |*****************                        147491.891 |***************                          130441.925 |*************                            108621.960 |***********                              91201.996 |*********                                77582.032 |********                                 64592.069 |******                                   54262.106 |*****                                    46782.145 |*****                                    41352.184 |****                                     35002.223 |****                                     30542.264 |***                                      27682.305 |***                                      23192.347 |**                                       20342.389 |**                                       17732.433 |**                                       15162.477 |**                                       13012.522 |*                                        10702.568 |*                                        9542.615 |*                                        7552.662 |*                                        6752.710 |*                                        6312.760 |*                                        4922.810 |*                                        4512.861 |
SQL statistics:queries performed:read:                            0write:                           744453other:                           0total:                           744453transactions:                        744453 (1240.74 per sec.)queries:                             744453 (1240.74 per sec.)ignored errors:                      0      (0.00 per sec.)reconnects:                          0      (0.00 per sec.)General statistics:total time:                          600.0049stotal number of events:              744453Latency (ms):min:                                    0.87avg:                                    1.61max:                                  926.3995th percentile:                        2.11sum:                              1196638.09Threads fairness:events (avg/stddev):           372226.5000/3.50execution time (avg/stddev):   598.3190/0.01
6) oltp_read_only.lua
$ sysbench --config-file=mysql-sb.cnf --tables=100 oltp_read_only.lua  run
sysbench 1.0.20 (using bundled LuaJIT 2.1.0-beta2)Running the test with following options:
Number of threads: 2
Initializing random number generator from current timeInitializing worker threads...Threads started!SQL statistics:queries performed:read:                            7425740write:                           0other:                           1060820total:                           8486560transactions:                        530410 (883.99 per sec.)queries:                             8486560 (14143.89 per sec.)ignored errors:                      0      (0.00 per sec.)reconnects:                          0      (0.00 per sec.)General statistics:total time:                          600.0137stotal number of events:              530410Latency (ms):min:                                    1.97avg:                                    2.26max:                                   54.6395th percentile:                        3.07sum:                              1198568.01Threads fairness:events (avg/stddev):           265205.0000/33.00execution time (avg/stddev):   599.2840/0.00
7) oltp_update_index.lua
$ sysbench --config-file=mysql-sb.cnf --tables=100 oltp_update_index.lua run
sysbench 1.0.20 (using bundled LuaJIT 2.1.0-beta2)Running the test with following options:
Number of threads: 2
Initializing random number generator from current timeInitializing worker threads...Threads started!SQL statistics:queries performed:read:                            0write:                           145095other:                           4800953total:                           4946048transactions:                        4946048 (8243.33 per sec.)queries:                             4946048 (8243.33 per sec.)ignored errors:                      0      (0.00 per sec.)reconnects:                          0      (0.00 per sec.)General statistics:total time:                          600.0030stotal number of events:              4946048Latency (ms):min:                                    0.12avg:                                    0.24max:                                  259.2595th percentile:                        0.42sum:                              1192593.66Threads fairness:events (avg/stddev):           2473024.0000/862.00execution time (avg/stddev):   596.2968/0.08
8) oltp_update_non_index.lua
$ sysbench --config-file=mysql-sb.cnf --tables=100 oltp_update_non_index.lua run
sysbench 1.0.20 (using bundled LuaJIT 2.1.0-beta2)Running the test with following options:
Number of threads: 2
Initializing random number generator from current timeInitializing worker threads...Threads started!SQL statistics:queries performed:read:                            0write:                           141508other:                           4686830total:                           4828338transactions:                        4828338 (8047.17 per sec.)queries:                             4828338 (8047.17 per sec.)ignored errors:                      0      (0.00 per sec.)reconnects:                          0      (0.00 per sec.)General statistics:total time:                          600.0022stotal number of events:              4828338Latency (ms):min:                                    0.12avg:                                    0.25max:                                  382.2895th percentile:                        0.44sum:                              1192434.24Threads fairness:events (avg/stddev):           2414169.0000/3780.00execution time (avg/stddev):   596.2171/0.04
9) select_random_points.lua
10) select_random_ranges.lua
11) bulk_insert.lua
此测试与前面那些测试有些不同,它只会创建与线程数相同的个数的表,并且没有 talbes 参数。因此我们需要修改执行命令,先清理 sbtest1 和 sbtest2 表的数据,然后再 prepare ,最后再 run 。
$ sysbench --config-file=mysql-sb.cnf bulk_insert.lua cleanup
$ sysbench --config-file=mysql-sb.cnf bulk_insert.lua prepare
$ sysbench --config-file=mysql-sb.cnf --tables=100 bulk_insert.lua run
sysbench 1.0.20 (using bundled LuaJIT 2.1.0-beta2)Running the test with following options:
Number of threads: 2
Initializing random number generator from current timeInitializing worker threads...Threads started!SQL statistics:queries performed:read:                            0write:                           2075other:                           0total:                           2075transactions:                        56561449 (94080.36 per sec.)queries:                             2075   (3.45 per sec.)ignored errors:                      0      (0.00 per sec.)reconnects:                          0      (0.00 per sec.)General statistics:total time:                          600.9490stotal number of events:              56561449Latency (ms):min:                                    0.00avg:                                    0.02max:                                 2011.2095th percentile:                        0.00sum:                              1182530.43Threads fairness:events (avg/stddev):           28280724.5000/13106.50execution time (avg/stddev):   591.2652/0.25
MySQL 数据库内的执行结果如下:
 MySQL  localhost:3310 ssl  sbtest  SQL > select count(*) from sbtest1;
+----------+
| count(*) |
+----------+
| 28293831 |
+----------+
1 row in set (1.7266 sec)MySQL  localhost:3310 ssl  sbtest  SQL > select count(*) from sbtest2;
+----------+
| count(*) |
+----------+
| 28267618 |
+----------+
1 row in set (1.8061 sec)
我们可以修改 times 参数为一个较小的值,因为没有必要批量插入 10 分钟的数据。
$ sysbench --config-file=mysql-sb.cnf bulk_insert.lua prepare --time=60
$ sysbench --config-file=mysql-sb.cnf bulk_insert.lua run --time=60
sysbench 1.0.20 (using bundled LuaJIT 2.1.0-beta2)Running the test with following options:
Number of threads: 2
Initializing random number generator from current timeInitializing worker threads...Threads started!SQL statistics:queries performed:read:                            0write:                           190other:                           0total:                           190transactions:                        5722434 (94526.75 per sec.)queries:                             190    (3.14 per sec.)ignored errors:                      0      (0.00 per sec.)reconnects:                          0      (0.00 per sec.)General statistics:total time:                          60.5316stotal number of events:              5722434Latency (ms):min:                                    0.00avg:                                    0.02max:                                 1102.7995th percentile:                        0.00sum:                               118906.30Threads fairness:events (avg/stddev):           2861217.0000/0.00execution time (avg/stddev):   59.4532/0.19
可以看到再命令行最后指定的 --times=60 覆盖了配置文件中指定的 time=600 。
 MySQL  localhost:3310 ssl  sbtest  SQL > select 'sbtest1' table_name,count(*) from sbtest1 union all-> select 'sbtest1' table_name,count(*) from sbtest2;
+------------+----------+
| table_name | count(*) |
+------------+----------+
| sbtest1    |  2861217 |
| sbtest1    |  2861217 |
+------------+----------+
2 rows in set (0.4175 sec)
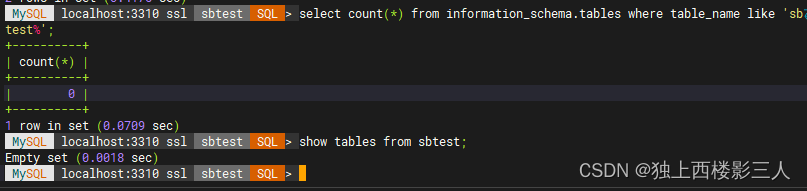
5、清理数据
$ sysbench --config-file=mysql-sb.cnf oltp_common.lua --tables=100 cleanup
6、销毁 MySQL 沙盒实例
在 mysqlsh 终端中执行:
 MySQL  localhost:3310 ssl  sbtest  JS > dba.stopSandboxInstance(3310)
The MySQL sandbox instance on this host in
3310 will be stoppedPlease enter the MySQL root password for the instance 'localhost:3310': ********
The active session is established to the sandbox being stopped so it's going to be closed.Stopping MySQL instance...Instance localhost:3310 successfully stopped.MySQL  JS > dba.deleteSandboxInstance(3310);Deleting MySQL instance...Instance localhost:3310 successfully deleted.