前言
multinma是由Phillippo开发的程序包,主要用来实现基于IPD校准的多水平网状Meta回归(ML-NMR),同时该程序包也可以用来实现传统的网状meta分析。今天的文章介绍如何使用multinma程序包实现生存数据的贝叶斯网状meta分析,用来评估6种免疫疗法( Camrelizumab、Tislelzumab、Toripalimab、Sintilimab、Pembrolizumab、Nivolumab)联合化疗方案治疗一线晚期或转移性鳞状食管癌的NMA。
程序包及数据加载
首先是相关程序包安装及加载,其次是数据的加载,multinma的数据要求与gemtc相同,多一列每种干预措施的样本量。
install.packages("multinma")
library(tidyverse)
library(multinma)
library(bayesplot)
library(cowplot)
OS <- read_csv("OS_HR.csv")
模型初始设定与网状证据图
通过set_agd_contrast进行模型的初始设定,然后使用plot函数进行网状证据图的绘制。
nma.set = set_agd_contrast(OS,trt_ref = "che",study = Study,trt = Treatment,y = logHR,se = std.err,sample_size = n)plot(nma.set, weight_edges = TRUE)

运行模型
使用nma函数运行NMA模型
os.nma<- nma(nma.set,trt_effects = "fixed", likelihood = "normal", link = "identity", seed = 123,adapt_delta = 0.90,warmup = 20000,iter = 40000,chains = 4)
模型运行过程

模型结果

使用dic查看模型拟合优度,可以对比固定模型和随机效应模型(DIC越小模型效果越好)
dic(os.nma)
--------------------------------------------------
Residual deviance: 6 (on 6 data points)pD: 6DIC: 12
mcmc诊断图
绘制贝叶斯需要诊断的三类图mcmc_trace(轨迹图)、mcmc_neff(有效样本量与总样本量的比率)和mcmc_rhat(Rhat是一种收敛诊断方法,它比较了各条链的参数估计值,Rhat值接近1说明链已经收敛并且混合良好;如果Rhat值为1.05或更高,表明存在收敛问题,需增大迭代量)
diag_plot <- function(model, pars_list, ncol_trace){color_scheme_set("teal")plt_1 <- mcmc_trace(as.array(model), pars = pars_list,facet_args = list(ncol = ncol_trace, strip.position = "left")) + theme_classic() + theme(axis.text = element_blank(),axis.ticks = element_blank(),strip.background = element_blank(),strip.text = element_blank(),legend.position = "none")plt_2 <- neff_ratio(model, pars = pars_list) %>%mcmc_neff() +theme_classic() + theme(legend.position = "none")plt_3 <-rhat(model, pars = pars_list) %>%mcmc_rhat() + #theme_+ theme(legend.position = "none")grid <-plot_grid(plt_2, plt_3, ncol = 2, align = "hv", axis = "b",rel_widths = c(1, 0.5))plot_grid(plt_1, grid, ncol = 1, align = "hv", axis = "l",rel_heights = c(0.5, 1))}
diag_plot(model = os.nma$stanfit,pars_list = c("d[cam_plus_che]","d[niv_plus_che]","d[pem_plus_che]","d[sin_plus_che]","d[tis_plus_che]","d[tor_plus_che]"),ncol_trace = 3)

森林图
使用plot绘制森林图(需要对模型结果进行log转换)
plot(os.nma, ref_line = 1)+scale_x_continuous(breaks = log(seq(0.2, 1.8, 0.2)),labels = seq(0.2, 1.8, 0.2),limits = log(c(0.4, 2

还可以绘制后验分布面积图对森林图进行美化
plot(os.nma, pars = "d",stat = "halfeye",point_interval = ggdist::median_hdi,.width = 0.95,ref_line = 0) + aes(fill = stat(x < 0))+scale_x_continuous(breaks = log(seq(0.2, 1.6, 0.2)),labels = seq(0.2, 1.6, 0.2),limits = log(c(0.4, 1.6)))+scale_fill_manual(values = c("#BFBFBF","#5C8286"))

概率排序图
使用posterior_rank_probs计算不同干预措施排序的概率
rankprobs <- posterior_rank_probs(os.nma)
plot(rankprobs)

通过设置sucra=TRUE,cumulative = TRUE计算不同干预措施排序的累积概率
cumrankprobs <- posterior_rank_probs(os.nma, sucra=TRUE,cumulative = TRUE)plot(cumrankprobs)

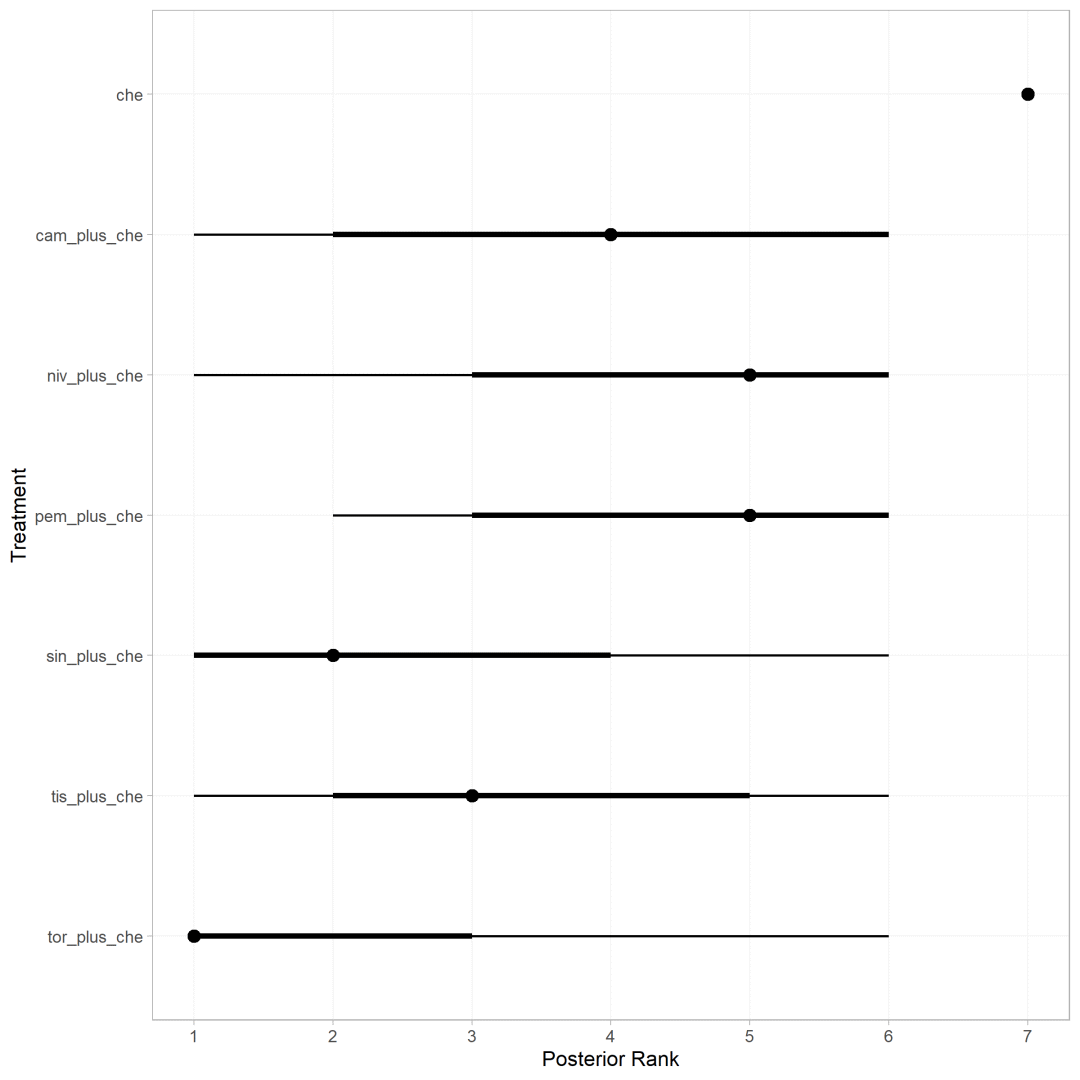
使用posterior_ranks计算不同干预措施成为最优方案的排序
ranks <- posterior_ranks(os.nma,lower_better=TRUE)
plot(ranks)
此外还可以对nma函数设置consistency="nodesplit"进行节点分割法判断模型的一致性,由于本次模型干预措施未连成网状,遂未展示。更多的功能与丰富案例可参考其官方手册。
参考文献
[1] https://dmphillippo.github.io/multinma/articles/example_hta_psoriasis.html.
[2] 小侃数据:手把手系列教程|基于贝叶斯学派使用R的multinma包做连续变量网状meta分析(https://mp.weixin.qq.com/s/se9fQe4CT4CEJbLQ-o5AZA)
[3] Gao, Tian-Tian et al. “Comparative efficacy and safety of immunotherapy for patients with advanced or metastatic esophageal squamous cell carcinoma: a systematic review and network Meta-analysis.” BMC cancer vol. 22,1 992. 17 Sep. 2022, doi:10.1186/s12885-022-10086-5IF: 3.8 Q2.


![[linux] AttributeError: module ‘transformer_engine‘ has no attribute ‘pytorch‘](https://img-blog.csdnimg.cn/direct/fc90b4653bd548d8acc13fe003d4768f.png)
