pyecharts操作二
-
pyecharts 是一个用于生成Echarts图表的Python库。Echarts是百度开源的一个数据可视化JS库,可以生成一些非常酷炫的图表。
-
环境安装
- pip install pyecharts
-
检查版本
import pyecharts
print(pyecharts.version)
2.0.3
- 3D柱状图绘制
import pyecharts.options as opts
from pyecharts.charts import Bar3D
hours = [
“12a”,
“1a”,
“2a”,
“3a”,
“4a”,
“5a”,
“6a”,
“7a”,
“8a”,
“9a”,
“10a”,
“11a”,
“12p”,
“1p”,
“2p”,
“3p”,
“4p”,
“5p”,
“6p”,
“7p”,
“8p”,
“9p”,
“10p”,
“11p”,
]
days = [“Saturday”, “Friday”, “Thursday”, “Wednesday”, “Tuesday”, “Monday”, “Sunday”]
data = [
[0, 0, 5],
[0, 1, 1],
[0, 2, 0],
[0, 3, 0],
[0, 4, 0],
[0, 5, 0],
[0, 6, 0],
[0, 7, 0],
[0, 8, 0],
[0, 9, 0],
[0, 10, 0],
[0, 11, 2],
[0, 12, 4],
[0, 13, 1],
[0, 14, 1],
[0, 15, 3],
[0, 16, 4],
[0, 17, 6],
[0, 18, 4],
[0, 19, 4],
[0, 20, 3],
[0, 21, 3],
[0, 22, 2],
[0, 23, 5],
[1, 0, 7],
[1, 1, 0],
[1, 2, 0],
[1, 3, 0],
[1, 4, 0],
[1, 5, 0],
[1, 6, 0],
[1, 7, 0],
[1, 8, 0],
[1, 9, 0],
[1, 10, 5],
[1, 11, 2],
[1, 12, 2],
[1, 13, 6],
[1, 14, 9],
[1, 15, 11],
[1, 16, 6],
[1, 17, 7],
[1, 18, 8],
[1, 19, 12],
[1, 20, 5],
[1, 21, 5],
[1, 22, 7],
[1, 23, 2],
[2, 0, 1],
[2, 1, 1],
[2, 2, 0],
[2, 3, 0],
[2, 4, 0],
[2, 5, 0],
[2, 6, 0],
[2, 7, 0],
[2, 8, 0],
[2, 9, 0],
[2, 10, 3],
[2, 11, 2],
[2, 12, 1],
[2, 13, 9],
[2, 14, 8],
[2, 15, 10],
[2, 16, 6],
[2, 17, 5],
[2, 18, 5],
[2, 19, 5],
[2, 20, 7],
[2, 21, 4],
[2, 22, 2],
[2, 23, 4],
[3, 0, 7],
[3, 1, 3],
[3, 2, 0],
[3, 3, 0],
[3, 4, 0],
[3, 5, 0],
[3, 6, 0],
[3, 7, 0],
[3, 8, 1],
[3, 9, 0],
[3, 10, 5],
[3, 11, 4],
[3, 12, 7],
[3, 13, 14],
[3, 14, 13],
[3, 15, 12],
[3, 16, 9],
[3, 17, 5],
[3, 18, 5],
[3, 19, 10],
[3, 20, 6],
[3, 21, 4],
[3, 22, 4],
[3, 23, 1],
[4, 0, 1],
[4, 1, 3],
[4, 2, 0],
[4, 3, 0],
[4, 4, 0],
[4, 5, 1],
[4, 6, 0],
[4, 7, 0],
[4, 8, 0],
[4, 9, 2],
[4, 10, 4],
[4, 11, 4],
[4, 12, 2],
[4, 13, 4],
[4, 14, 4],
[4, 15, 14],
[4, 16, 12],
[4, 17, 1],
[4, 18, 8],
[4, 19, 5],
[4, 20, 3],
[4, 21, 7],
[4, 22, 3],
[4, 23, 0],
[5, 0, 2],
[5, 1, 1],
[5, 2, 0],
[5, 3, 3],
[5, 4, 0],
[5, 5, 0],
[5, 6, 0],
[5, 7, 0],
[5, 8, 2],
[5, 9, 0],
[5, 10, 4],
[5, 11, 1],
[5, 12, 5],
[5, 13, 10],
[5, 14, 5],
[5, 15, 7],
[5, 16, 11],
[5, 17, 6],
[5, 18, 0],
[5, 19, 5],
[5, 20, 3],
[5, 21, 4],
[5, 22, 2],
[5, 23, 0],
[6, 0, 1],
[6, 1, 0],
[6, 2, 0],
[6, 3, 0],
[6, 4, 0],
[6, 5, 0],
[6, 6, 0],
[6, 7, 0],
[6, 8, 0],
[6, 9, 0],
[6, 10, 1],
[6, 11, 0],
[6, 12, 2],
[6, 13, 1],
[6, 14, 3],
[6, 15, 4],
[6, 16, 0],
[6, 17, 0],
[6, 18, 0],
[6, 19, 0],
[6, 20, 1],
[6, 21, 2],
[6, 22, 2],
[6, 23, 6],
]
data = [[d[1], d[0], d[2]] for d in data]
bar = (
Bar3D()
.add(
series_name=“”,
data=data,
xaxis3d_opts=opts.Axis3DOpts(type_=“category”, data=hours),
yaxis3d_opts=opts.Axis3DOpts(type_=“category”, data=days),
zaxis3d_opts=opts.Axis3DOpts(type_=“value”),
)
.set_global_opts(
visualmap_opts=opts.VisualMapOpts(
max_=20,
range_color=[
“#313695”,
“#4575b4”,
“#74add1”,
“#abd9e9”,
“#e0f3f8”,
“#ffffbf”,
“#fee090”,
“#fdae61”,
“#f46d43”,
“#d73027”,
“#a50026”,
],
)
)
)
bar.render_notebook()

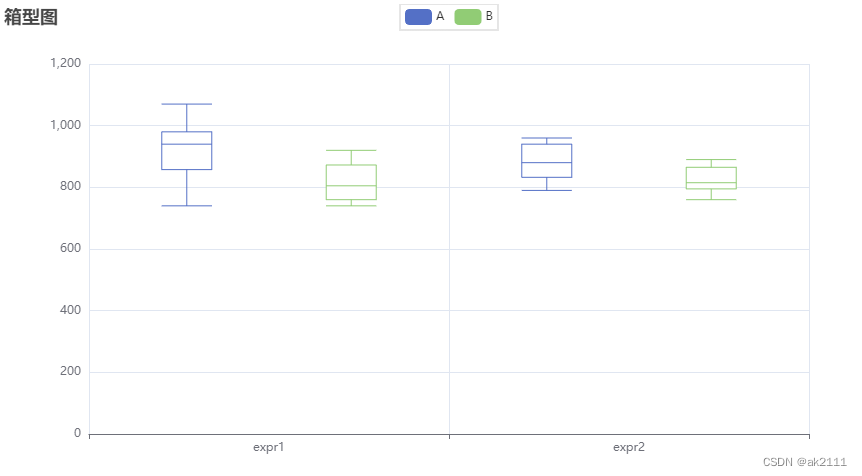
- 箱型图
from pyecharts import options as opts
from pyecharts.charts import Boxplot
v1 = [
[850, 740, 900, 1070, 930, 850, 950, 980, 980, 880, 1000, 980],
[960, 940, 960, 940, 880, 800, 850, 880, 900, 840, 830, 790],
]
v2 = [
[890, 810, 810, 820, 800, 770, 760, 740, 750, 760, 910, 920],
[890, 840, 780, 810, 760, 810, 790, 810, 820, 850, 870, 870],
]
Boxplot = Boxplot()
Boxplot.add_xaxis([“expr1”, “expr2”])
Boxplot.add_yaxis(“A”, Boxplot.prepare_data(v1))
Boxplot.add_yaxis(“B”, Boxplot.prepare_data(v2))
Boxplot.set_global_opts(title_opts=opts.TitleOpts(title=“箱型图”))
Boxplot.render_notebook()
- 日历图
import datetime
import random
from pyecharts import options as opts
from pyecharts.charts import Calendar
begin = datetime.date(2023, 1, 1)
end = datetime.date(2023, 12, 31)
data = [
[str(begin + datetime.timedelta(days=i)), random.randint(100, 35000)]
for i in range((end - begin).days + 1)
]
Calendar = (
Calendar()
.add(
“”,
data,
calendar_opts=opts.CalendarOpts(
range_=“2023”,
daylabel_opts=opts.CalendarDayLabelOpts(name_map=“cn”),
monthlabel_opts=opts.CalendarMonthLabelOpts(name_map=“cn”),
),
)
.set_global_opts(
title_opts=opts.TitleOpts(title=“日历图-2023年步数情况”),
visualmap_opts=opts.VisualMapOpts(
max_=33126,
min_=600,
orient=“horizontal”,
is_piecewise=True,
pos_top=“230px”,
pos_left=“100px”,
),
)
)
Calendar.render_notebook()

- K线图
from pyecharts import options as opts
from pyecharts.charts import Kline
data = [
[2320.26, 2320.26, 2287.3, 2362.94],
[2300, 2291.3, 2288.26, 2308.38],
[2295.35, 2346.5, 2295.35, 2345.92],
[2347.22, 2358.98, 2337.35, 2363.8],
[2360.75, 2382.48, 2347.89, 2383.76],
[2383.43, 2385.42, 2371.23, 2391.82],
[2377.41, 2419.02, 2369.57, 2421.15],
[2425.92, 2428.15, 2417.58, 2440.38],
[2411, 2433.13, 2403.3, 2437.42],
[2432.68, 2334.48, 2427.7, 2441.73],
[2430.69, 2418.53, 2394.22, 2433.89],
[2416.62, 2432.4, 2414.4, 2443.03],
[2441.91, 2421.56, 2418.43, 2444.8],
[2420.26, 2382.91, 2373.53, 2427.07],
[2383.49, 2397.18, 2370.61, 2397.94],
[2378.82, 2325.95, 2309.17, 2378.82],
[2322.94, 2314.16, 2308.76, 2330.88],
[2320.62, 2325.82, 2315.01, 2338.78],
[2313.74, 2293.34, 2289.89, 2340.71],
[2297.77, 2313.22, 2292.03, 2324.63],
[2322.32, 2365.59, 2308.92, 2366.16],
[2364.54, 2359.51, 2330.86, 2369.65],
[2332.08, 2273.4, 2259.25, 2333.54],
[2274.81, 2326.31, 2270.1, 2328.14],
[2333.61, 2347.18, 2321.6, 2351.44],
[2340.44, 2324.29, 2304.27, 2352.02],
[2326.42, 2318.61, 2314.59, 2333.67],
[2314.68, 2310.59, 2296.58, 2320.96],
[2309.16, 2286.6, 2264.83, 2333.29],
[2282.17, 2263.97, 2253.25, 2286.33],
[2255.77, 2270.28, 2253.31, 2276.22],
]
k = (
Kline()
.add_xaxis([“2023/7/{}”.format(i + 1) for i in range(31)])
.add_yaxis(“kline”, data)
.set_global_opts(
xaxis_opts=opts.AxisOpts(is_scale=True),
yaxis_opts=opts.AxisOpts(
is_scale=True,
splitarea_opts=opts.SplitAreaOpts(
is_show=True, areastyle_opts=opts.AreaStyleOpts(opacity=1)
),
),
datazoom_opts=[opts.DataZoomOpts()],
title_opts=opts.TitleOpts(title=“k线图”),
)
)
k.render_notebook()

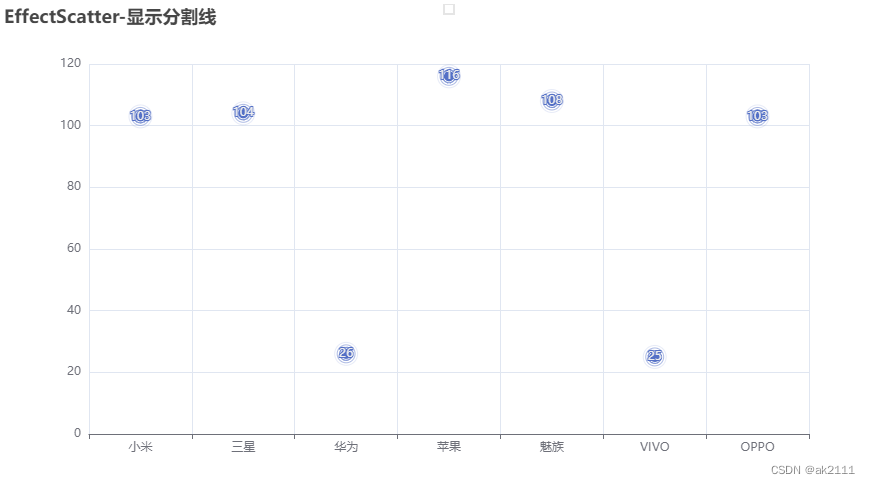
- 涟漪散点图
from pyecharts import options as opts
from pyecharts.charts import EffectScatter
from pyecharts.faker import Faker
e = (
EffectScatter()
.add_xaxis(Faker.choose())#随机选择一组
.add_yaxis(“”, Faker.values())
.set_global_opts(
title_opts=opts.TitleOpts(title=“EffectScatter-显示分割线”),
xaxis_opts=opts.AxisOpts(splitline_opts=opts.SplitLineOpts(is_show=True)),
yaxis_opts=opts.AxisOpts(splitline_opts=opts.SplitLineOpts(is_show=True)),
)
)
e.render_notebook()
- 热力图
from pyecharts import options as opts
from pyecharts.charts import Geo
from pyecharts.faker import Faker
from pyecharts.globals import ChartType
h = (
Geo()
.add_schema(maptype=“china”)
.add(
“”,
[list(z) for z in zip(Faker.provinces, Faker.values())],
type_=ChartType.HEATMAP,
)
.set_series_opts(label_opts=opts.LabelOpts(is_show=False))
.set_global_opts(
visualmap_opts=opts.VisualMapOpts(),
title_opts=opts.TitleOpts(title=“热力图”),
)
)
h.render_notebook()

- 组合组件
from pyecharts import options as opts
from pyecharts.charts import Bar, Grid, Line
bar = (
Bar()
.add_xaxis([“{}月”.format(i) for i in range(1, 13)])
.add_yaxis(
“蒸发量”,
[3.0, 5.9, 8.0, 24.2, 26.6, 77.7, 136.6, 163.2, 33.6, 21.0, 7.4, 4.3],
yaxis_index=0,
color=“#d14a61”,
)
.add_yaxis(
“降水量”,
[3.6, 6.9, 10.0, 27.4, 29.7, 71.7, 176.6, 183.2, 49.7, 19.8, 7.0, 3.3],
yaxis_index=1,
color=“#5793f3”,
)
.extend_axis(
yaxis=opts.AxisOpts(
name=“蒸发量”,
type_=“value”,
min_=0,
max_=250,
position=“right”,
axisline_opts=opts.AxisLineOpts(
linestyle_opts=opts.LineStyleOpts(color=“#d14a61”)
),
axislabel_opts=opts.LabelOpts(formatter=“{value} ml”),
)
)
.extend_axis(
yaxis=opts.AxisOpts(
type_=“value”,
name=“温度”,
min_=0,
max_=25,
position=“left”,
axisline_opts=opts.AxisLineOpts(
linestyle_opts=opts.LineStyleOpts(color=“#675bba”)
),
axislabel_opts=opts.LabelOpts(formatter=“{value} °C”),
splitline_opts=opts.SplitLineOpts(
is_show=True, linestyle_opts=opts.LineStyleOpts(opacity=1)
),
)
)
.set_global_opts(
yaxis_opts=opts.AxisOpts(
name=“降水量”,
min_=0,
max_=250,
position=“right”,
offset=80,
axisline_opts=opts.AxisLineOpts(
linestyle_opts=opts.LineStyleOpts(color=“#5793f3”)
),
axislabel_opts=opts.LabelOpts(formatter=“{value} ml”),
),
title_opts=opts.TitleOpts(title=“多 X/Y 轴示例”),
tooltip_opts=opts.TooltipOpts(trigger=“axis”, axis_pointer_type=“cross”),
legend_opts=opts.LegendOpts(pos_left=“25%”),
)
)
line = (
Line()
.add_xaxis([“{}月”.format(i) for i in range(1, 13)])
.add_yaxis(
“平均温度”,
[3.0, 3.2, 4.3, 5.5, 7.3, 11.2, 21.3, 24.4, 24.0, 17.5, 13.0, 7.2],
yaxis_index=2,
color=“#675bba”,
label_opts=opts.LabelOpts(is_show=False),
)
)
bar1 = (
Bar()
.add_xaxis([“{}月”.format(i) for i in range(1, 13)])
.add_yaxis(
“蒸发量 1”,
[3.0, 5.9, 8.0, 24.2, 26.6, 77.7, 136.6, 163.2, 33.6, 21.0, 7.4, 4.3],
color=“#d14a61”,
xaxis_index=1,
yaxis_index=3,
)
.add_yaxis(
“降水量 2”,
[3.6, 6.9, 10.0, 27.4, 29.7, 71.7, 176.6, 183.2, 49.7, 19.8, 7.0, 3.3],
color=“#5793f3”,
xaxis_index=1,
yaxis_index=4,
)
.extend_axis(
yaxis=opts.AxisOpts(
name=“蒸发量”,
type_=“value”,
min_=0,
max_=250,
position=“right”,
axisline_opts=opts.AxisLineOpts(
linestyle_opts=opts.LineStyleOpts(color=“#d14a61”)
),
axislabel_opts=opts.LabelOpts(formatter=“{value} ml”),
)
)
.extend_axis(
yaxis=opts.AxisOpts(
type_=“value”,
name=“温度”,
min_=0,
max_=25,
position=“left”,
axisline_opts=opts.AxisLineOpts(
linestyle_opts=opts.LineStyleOpts(color=“#675bba”)
),
axislabel_opts=opts.LabelOpts(formatter=“{value} °C”),
splitline_opts=opts.SplitLineOpts(
is_show=True, linestyle_opts=opts.LineStyleOpts(opacity=1)
),
)
)
.set_global_opts(
xaxis_opts=opts.AxisOpts(grid_index=1),
yaxis_opts=opts.AxisOpts(
name=“降水量”,
min_=0,
max_=250,
position=“right”,
offset=80,
axisline_opts=opts.AxisLineOpts(
linestyle_opts=opts.LineStyleOpts(color=“#5793f3”)
),
axislabel_opts=opts.LabelOpts(formatter=“{value} ml”),
),
tooltip_opts=opts.TooltipOpts(trigger=“axis”, axis_pointer_type=“cross”),
legend_opts=opts.LegendOpts(pos_left=“65%”),
)
)
line1 = (
Line()
.add_xaxis([“{}月”.format(i) for i in range(1, 13)])
.add_yaxis(
“平均温度 1”,
[3.0, 3.2, 4.3, 5.5, 7.3, 11.2, 21.3, 24.4, 24.0, 17.5, 13.0, 7.2],
color=“#675bba”,
label_opts=opts.LabelOpts(is_show=False),
xaxis_index=1,
yaxis_index=5,
)
)
overlap_1 = bar.overlap(line)
overlap_2 = bar1.overlap(line1)
grid = (
Grid(init_opts=opts.InitOpts(width=“1200px”, height=“800px”))
.add(
overlap_1, grid_opts=opts.GridOpts(pos_right=“58%”), is_control_axis_index=True
)
.add(overlap_2, grid_opts=opts.GridOpts(pos_left=“58%”), is_control_axis_index=True)
)
grid.render_notebook()

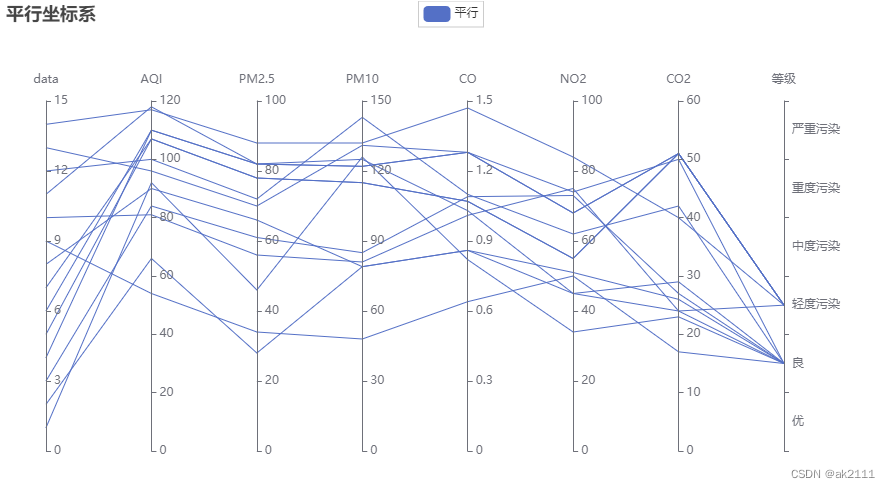
- 平行坐标系
from pyecharts import options as opts
from pyecharts.charts import Parallel
data = [
[1, 92, 46, 126, 0.82, 34, 23, “良”],
[2, 66, 28, 79, 0.86, 45, 29, “良”],
[3, 84, 61, 85, 1.09, 73, 27, “良”],
[4, 110, 82, 122, 1.28, 68, 51, “轻度污染”],
[5, 107, 78, 115, 1.07, 55, 51, “轻度污染”],
[6, 110, 82, 122, 1.28, 68, 51, “轻度污染”],
[7, 107, 78, 115, 1.07, 55, 51, “轻度污染”],
[8, 90, 66, 79, 0.86, 51, 26, “良”],
[9, 54, 34, 48, 0.64, 50, 17, “良”],
[10, 81, 56, 81, 1.01, 75, 24, “良”],
[11, 118, 82, 125, 1.03, 45, 24, “轻度污染”],
[12, 100, 72, 143, 1.1, 62, 42, “良”],
[13, 96, 70, 131, 1.28, 74, 50, “良”],
[14, 117, 88, 132, 1.47, 84, 40, “轻度污染”],
]
p = (
Parallel()
.add_schema(
[
opts.ParallelAxisOpts(dim=0, name=“data”),
opts.ParallelAxisOpts(dim=1, name=“AQI”),
opts.ParallelAxisOpts(dim=2, name=“PM2.5”),
opts.ParallelAxisOpts(dim=3, name=“PM10”),
opts.ParallelAxisOpts(dim=4, name=“CO”),
opts.ParallelAxisOpts(dim=5, name=“NO2”),
opts.ParallelAxisOpts(dim=6, name=“CO2”),
opts.ParallelAxisOpts(
dim=7,
name=“等级”,
type_=“category”,
data=[“优”, “良”, “轻度污染”, “中度污染”, “重度污染”, “严重污染”],
),
]
)
.add(“平行”, data)
.set_global_opts(title_opts=opts.TitleOpts(title=“平行坐标系”))
)
p.render_notebook()
- 极坐标系
import random
from pyecharts import options as opts
from pyecharts.charts import Polar
data = [(i, random.randint(1, 100)) for i in range(10)]
c = (
Polar()
.add(
“”,
data,
type_=“effectScatter”,
effect_opts=opts.EffectOpts(scale=10, period=5),
label_opts=opts.LabelOpts(is_show=False),
)
.set_global_opts(title_opts=opts.TitleOpts(title=“极轴效果散射”))
)
c.render_notebook()

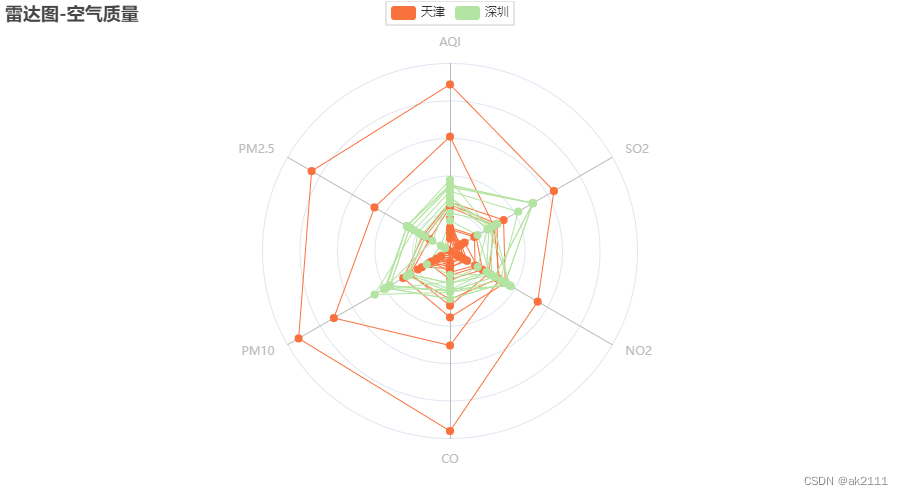
- 雷达图
from pyecharts import options as opts
from pyecharts.charts import Radar
value_bj = [
[55, 9, 56, 0.46, 18, 6, 1],
[25, 11, 21, 0.65, 34, 9, 2],
[56, 7, 63, 0.3, 14, 5, 3],
[33, 7, 29, 0.33, 16, 6, 4],
[42, 24, 44, 0.76, 40, 16, 5],
[82, 58, 90, 1.77, 68, 33, 6],
[74, 49, 77, 1.46, 48, 27, 7],
[78, 55, 80, 1.29, 59, 29, 8],
[267, 216, 280, 4.8, 108, 64, 9],
[185, 127, 216, 2.52, 61, 27, 10],
[39, 19, 38, 0.57, 31, 15, 11],
[41, 11, 40, 0.43, 21, 7, 12],
]
value_sh = [
[91, 45, 125, 0.82, 34, 23, 1],
[65, 27, 78, 0.86, 45, 29, 2],
[83, 60, 84, 1.09, 73, 27, 3],
[109, 81, 121, 1.28, 68, 51, 4],
[106, 77, 114, 1.07, 55, 51, 5],
[109, 81, 121, 1.28, 68, 51, 6],
[106, 77, 114, 1.07, 55, 51, 7],
[89, 65, 78, 0.86, 51, 26, 8],
[53, 33, 47, 0.64, 50, 17, 9],
[80, 55, 80, 1.01, 75, 24, 10],
[117, 81, 124, 1.03, 45, 24, 11],
[99, 71, 142, 1.1, 62, 42, 12],
]
c_schema = [
{“name”: “AQI”, “max”: 300, “min”: 5},
{“name”: “PM2.5”, “max”: 250, “min”: 20},
{“name”: “PM10”, “max”: 300, “min”: 5},
{“name”: “CO”, “max”: 5},
{“name”: “NO2”, “max”: 200},
{“name”: “SO2”, “max”: 100},
]
c = (
Radar()
.add_schema(schema=c_schema, shape=“circle”)
.add(“天津”, value_bj, color=“#f9713c”)
.add(“深圳”, value_sh, color=“#b3e4a1”)
.set_series_opts(label_opts=opts.LabelOpts(is_show=False))
.set_global_opts(title_opts=opts.TitleOpts(title=“雷达图-空气质量”))
)
c.render_notebook()
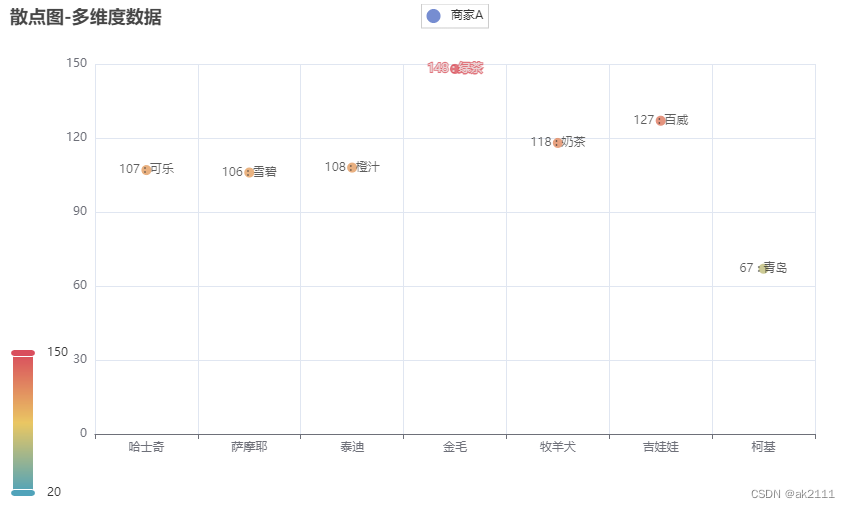
- 散点图
from pyecharts import options as opts
from pyecharts.charts import Scatter
from pyecharts.commons.utils import JsCode
from pyecharts.faker import Faker
c = (
Scatter()
.add_xaxis(Faker.choose())#随机选择
.add_yaxis(
“商家A”,
[list(z) for z in zip(Faker.values(), Faker.choose())],
label_opts=opts.LabelOpts(
formatter=JsCode(
“function(params){return params.value[1] +’ : '+ params.value[2];}”
)
),
)
.set_global_opts(
title_opts=opts.TitleOpts(title=“散点图-多维度数据”),
tooltip_opts=opts.TooltipOpts(
formatter=JsCode(
“function (params) {return params.name + ’ : ’ + params.value[2];}”
)
),
visualmap_opts=opts.VisualMapOpts(
type_=“color”, max_=150, min_=20, dimension=1
),
)
)
c.render_notebook()
源文件可在这里下载:
https://download.csdn.net/download/ak2111/89043219?spm=1001.2014.3001.5501
