K近邻算法
import matplotlib.pyplot as plt
import numpy as np
import os# 读入mnist数据集
m_x = np.loadtxt('mnist_x', delimiter=' ')
m_y = np.loadtxt('mnist_y')# 数据集可视化
data = np.reshape(np.array(m_x[0], dtype=int), [28, 28])
plt.figure()
plt.imshow(data, cmap='gray')# 将数据集分为训练集和测试集
ratio = 0.8
split = int(len(m_x) * ratio)
# 打乱数据
np.random.seed(0)
idx = np.random.permutation(np.arange(len(m_x)))
m_x = m_x[idx]
m_y = m_y[idx]
x_train, x_test = m_x[:split], m_x[split:]
y_train, y_test = m_y[:split], m_y[split:]
delimiter=' '表示使用空格作为分隔符

data = np.reshape(np.array(m_x[0], dtype=int), [28, 28])获取一个图片的像素后变成28x28
idx = np.random.permutation(np.arange(len(m_x)))获取索引后,打乱索引
class KNN:def __init__(self, k, label_num):self.k = kself.label_num = label_num # 类别的数量def fit(self, x_train, y_train):# 在类中保存训练数据self.x_train = x_trainself.y_train = y_traindef get_knn_indices(self, x):# 获取距离目标样本点最近的K个样本点的标签# 计算已知样本的距离dis = list(map(lambda a: distance(a, x), self.x_train))# 按距离从小到大排序,并得到对应的下标knn_indices = np.argsort(dis)# 取最近的K个knn_indices = knn_indices[:self.k]return knn_indicesdef get_label(self, x):# 对KNN方法的具体实现,观察K个近邻并使用np.argmax获取其中数量最多的类别knn_indices = self.get_knn_indices(x)# 类别计数label_statistic = np.zeros(shape=[self.label_num])for index in knn_indices:label = int(self.y_train[index])label_statistic[label] += 1# 返回数量最多的类别return np.argmax(label_statistic)def predict(self, x_test):# 预测样本 test_x 的类别predicted_test_labels = np.zeros(shape=[len(x_test)], dtype=int)for i, x in enumerate(x_test):predicted_test_labels[i] = self.get_label(x)return predicted_test_labelsargsort得到排序后对应的下标,截断k个返回
用下标到self.y_train中提取具体label并计数,然后argmax返回最大值的下标,在这里是标签
from sklearn.neighbors import KNeighborsClassifier # sklearn中的KNN分类器
from matplotlib.colors import ListedColormap# 读入高斯数据集
data = np.loadtxt('gauss.csv', delimiter=',')
x_train = data[:, :2]
y_train = data[:, 2]
print('数据集大小:', len(x_train))# 可视化
plt.figure()
plt.scatter(x_train[y_train == 0, 0], x_train[y_train == 0, 1], c='blue', marker='o')
plt.scatter(x_train[y_train == 1, 0], x_train[y_train == 1, 1], c='red', marker='x')
plt.xlabel('X axis')
plt.ylabel('Y axis')
plt.show()
x_train = data[:, :2]
y_train = data[:, 2]
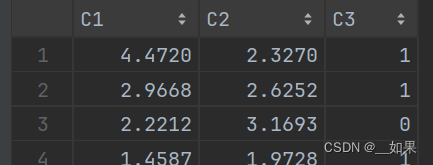
x_train[y_train == 0, 0]:表示选择标签为0的样本点的第一个特征(x轴坐标)
x_train[y_train == 0, 1]:表示选择标签为0的样本点的第二个特征(y轴坐标)
# 设置步长
step = 0.02
# 设置网格边界
x_min, x_max = np.min(x_train[:, 0]) - 1, np.max(x_train[:, 0]) + 1
y_min, y_max = np.min(x_train[:, 1]) - 1, np.max(x_train[:, 1]) + 1
# 构造网格
xx, yy = np.meshgrid(np.arange(x_min, x_max, step), np.arange(y_min, y_max, step))
grid_data = np.concatenate([xx.reshape(-1, 1), yy.reshape(-1, 1)], axis=1)
x、y轴上最大值+1最小值-1得到边界
np.meshgrid()函数生成一个二维数组,其中的每个元素都是一对坐标值,这些坐标值构成了一个网格
np.concatenate() 函数将 xx 和 yy 两个列向量按列方向(axis=1)进行拼接
fig = plt.figure(figsize=(16,4.5))
# K值,读者可以自行调整,观察分类结果的变化
ks = [1, 3, 10]
cmap_light = ListedColormap(['royalblue', 'lightcoral'])for i, k in enumerate(ks):# 定义KNN分类器knn = KNeighborsClassifier(n_neighbors=k) knn.fit(x_train, y_train)z = knn.predict(grid_data)# 画出分类结果ax = fig.add_subplot(1, 3, i + 1)ax.pcolormesh(xx, yy, z.reshape(xx.shape), cmap=cmap_light, alpha=0.7)ax.scatter(x_train[y_train == 0, 0], x_train[y_train == 0, 1], c='blue', marker='o')ax.scatter(x_train[y_train == 1, 0], x_train[y_train == 1, 1], c='red', marker='x')ax.set_xlabel('X axis')ax.set_ylabel('Y axis')ax.set_title(f'K = {k}')
plt.show() z.reshape(xx.shape):z 是对网格数据的预测结果,它是一个一维数组,需要通过 reshape() 函数重新整形为与网格数据相同的形状,这样才能与网格数据对应起来
alpha=0.7:指定了绘制颜色的透明度,这里是0.7,表示颜色相对不透明
# block_size表示向外扩展的层数,扩展1层即3*3
block_size = 1 def read_style_image(file_name, size=block_size):# 读入风格图像, 得到映射 X->Y# 其中X储存3*3像素格的灰度值,Y储存中心像素格的色彩值# 读取图像文件,设图像宽为W,高为H,得到W*H*3的RGB矩阵img = io.imread(file_name) fig = plt.figure()plt.imshow(img)plt.xlabel('X axis')plt.ylabel('Y axis')plt.show()# 将RGB矩阵转换成LAB表示法的矩阵,大小仍然是W*H*3,三维分别是L、A、Bimg = rgb2lab(img) # 取出图像的宽度和高度w, h = img.shape[:2] X = []Y = []# 枚举全部可能的中心点for x in range(size, w - size): for y in range(size, h - size):# 保存所有窗口X.append(img[x - size: x + size + 1, \y - size: y + size + 1, 0].flatten())# 保存窗口对应的色彩值a和bY.append(img[x, y, 1:])return X, Y
L、A、B分别代表亮度、色度和色彩度
LAB颜色空间是一种常用的颜色表示方法,它将颜色分为亮度(L)和两个色度分量(A和B),可以更好地模拟人类视觉系统对颜色的感知。
具体来说,LAB颜色空间有三个通道:
- L 表示亮度(Lightness),取值范围为0到100,表示黑到白。
- A 表示从绿色到红色的范围,负值表示绿色,正值表示红色。
- B 表示从蓝色到黄色的范围,负值表示蓝色,正值表示黄色。
将RGB图像转换为LAB颜色空间的图像可以使得图像在颜色的表达上更加准确和稳定,同时也便于进行一些颜色相关的图像处理任务,比如颜色修正、颜色分割等。
x.append做了一个滑窗
图像中不同位置的像素通常包含了不同的信息,例如边缘、纹理等
图像中的像素通常具有一定的空间相关性,相邻像素之间可能存在一定的关联关系
可以将注意力集中在局部区域,从而更加高效地处理图像
色彩值是AB,所以是 1:
X, Y = read_style_image(os.path.join(path, 'style.jpg')) # 建立映射# weights='distance'表示邻居的权重与其到样本的距离成反比
knn = KNeighborsRegressor(n_neighbors=4, weights='distance')
knn.fit(X, Y)
通过read_style_image得到一个颜色的映射,也就是RGB->LAB
def rebuild(img, size=block_size):# 打印内容图像fig = plt.figure()plt.imshow(img)plt.xlabel('X axis')plt.ylabel('Y axis')plt.show()# 将内容图像转为LAB表示img = rgb2lab(img) w, h = img.shape[:2]# 初始化输出图像对应的矩阵photo = np.zeros([w, h, 3])# 枚举内容图像的中心点,保存所有窗口print('Constructing window...')X = []for x in range(size, w - size):for y in range(size, h - size):# 得到中心点对应的窗口window = img[x - size: x + size + 1, \y - size: y + size + 1, 0].flatten()X.append(window)X = np.array(X)# 用KNN回归器预测颜色print('Predicting...')pred_ab = knn.predict(X).reshape(w - 2 * size, h - 2 * size, -1)# 设置输出图像photo[:, :, 0] = img[:, :, 0]photo[size: w - size, size: h - size, 1:] = pred_ab# 由于最外面size层无法构造窗口,简单起见,我们直接把这些像素裁剪掉photo = photo[size: w - size, size: h - size, :]return photo将预测的色度值填充到 photo 中对应的位置
当时滑窗余了一部分,这里全切掉
K最近邻(KNN)模型的作用是根据给定的窗口特征 X,预测对应的色度值 pred_ab
对于给定的窗口特征
X,首先计算它与训练集中所有窗口特征的距离,根据距离的大小,选取距离最近的K个邻居,使用这K个最近邻的目标值(在这里是色度值)进行加权平均,其中权重通常与距离成反比关系
习题
1.错误。KNN常使用交叉验证的方法确定K
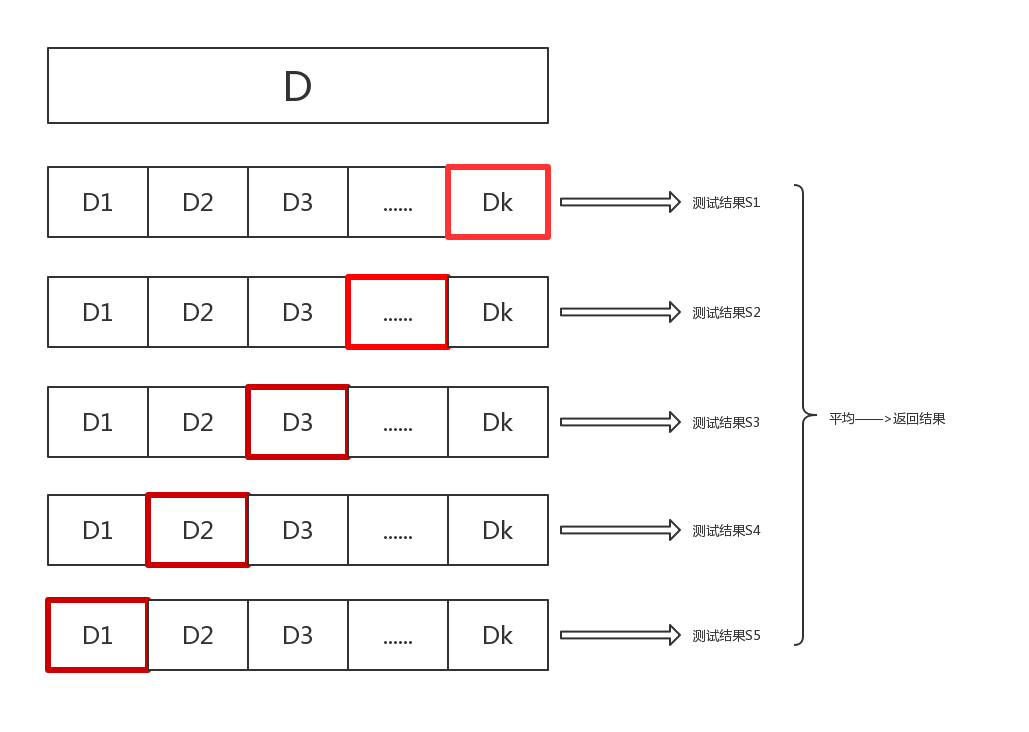
2.C。K是超参数,人为设置的
3.
-
稀疏数据:在数据稀疏的情况下,尤其是在特征空间中存在大量零值时(例如,用户对电影的评分矩阵),曼哈顿距离可能更合适,因为它不会因为零值特征的欧氏距离为零而忽略非零特征之间的差异。
-
异常值敏感性:欧氏距离对异常值比较敏感,因为异常值会在高维空间中拉大与其他点的距离。曼哈顿距离由于只考虑各个维度上的绝对差异,因此对异常值的敏感性较低。
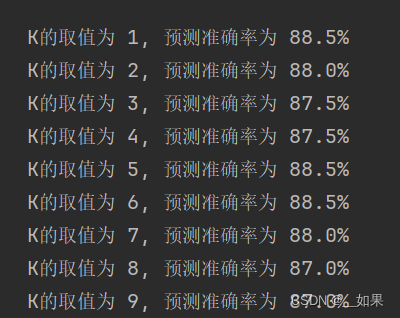
改为曼哈顿距离:
def distance(a, b):return np.sum(np.abs(a - b))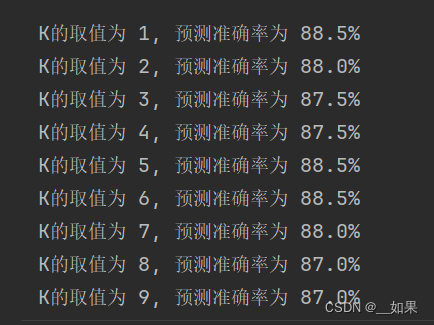
曼哈顿 欧几里得
4.
-
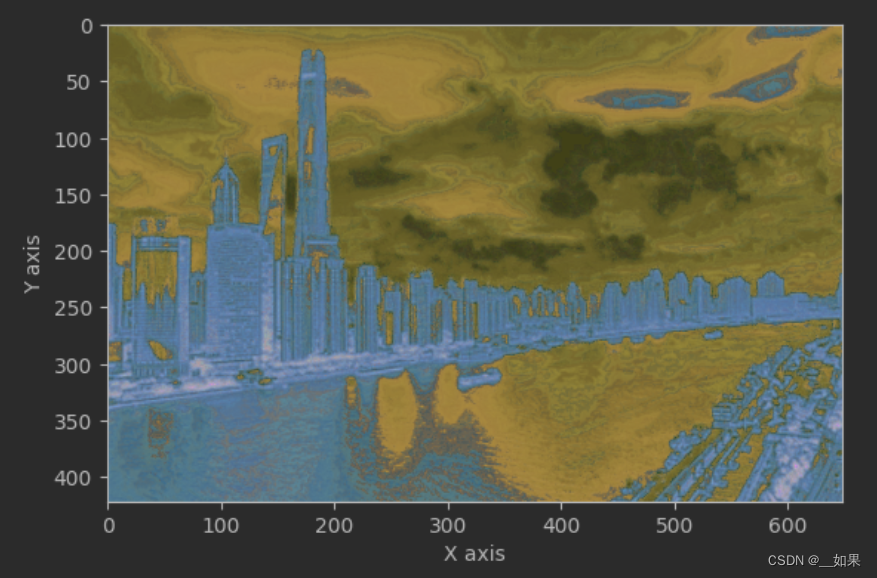
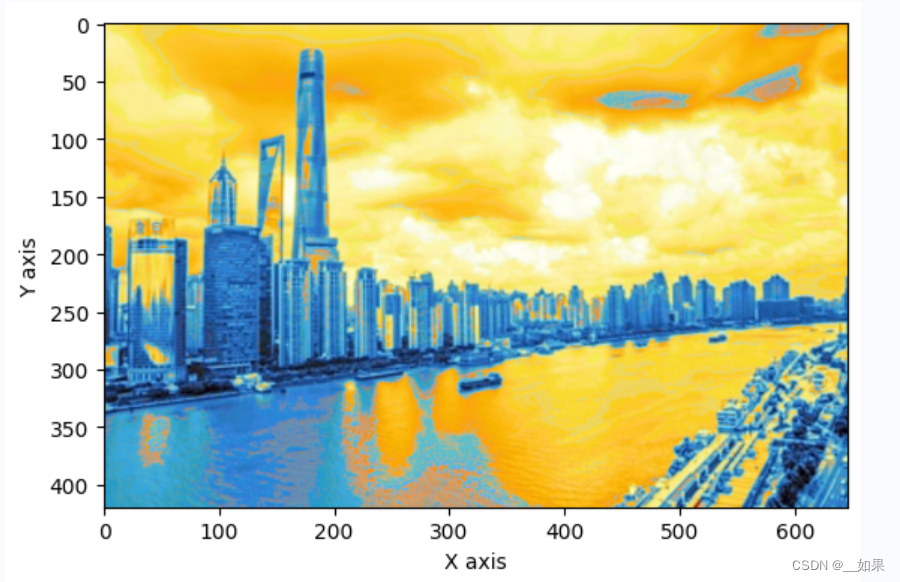
失去局部细节:增大采样窗口会导致对局部细节的损失,因为每个像素点的颜色值是通过周围更大范围的像素值来预测的。这可能会导致图像的局部结构和纹理细节被模糊化。
-
计算复杂度增加:随着采样窗口的增大,需要考虑的颜色空间的维度也会增加,从而导致计算复杂度的增加。KNN回归器的训练和预测过程可能会变得更加耗时。
-
可能的颜色偏移:采样窗口增大可能会导致对颜色平滑度的过度假设,这可能会导致在图像中出现颜色偏移或色块。特别是对于细节丰富的图像,增大采样窗口可能会产生不自然的结果。
block_size为1 block_size为2
5.略
6.
# 创建由多张图像构成的数据集,num表示图像数量
# 返回的X、Y的含义与函数read_style_image相同
def create_dataset(data_dir='vangogh', num=10):# 初始化函数输出X = []Y = []# 读取图像files = np.sort(os.listdir(os.path.join(path, data_dir)))num = min(num, len(files))for file in files[:num]:print('reading', file)X0, Y0 = read_style_image(os.path.join(path, data_dir, file))X.extend(X0)Y.extend(Y0)return X, YX, Y = create_dataset()
knn = KNeighborsRegressor(n_neighbors=4, weights='distance')
knn.fit(X, Y)content = io.imread(os.path.join(path, 'input.jpg'))
new_photo = rebuild(content)
new_photo = lab2rgb(new_photo)fig = plt.figure()
plt.imshow(new_photo)
plt.xlabel('X axis')
plt.ylabel('Y axis')
plt.show()
之前用的一张照片的滑窗训练,现在加个for循环把窗口一起放数组里




![[flink 实时流基础] flink组件栈以及任务执行与资源划分](https://img-blog.csdnimg.cn/img_convert/ea5ddc3582cd097dd41eaeefff4c3d32.png)
