目录
数据格式
绘图
①根据剂量
②根据type
③根据治疗响应度
添加水平线
数据格式
肿瘤免疫响应数据
rm(list = ls())
library(tidyverse)
library(dplyr)
library(knitr)#模拟数据
# We will randomly assign the two doses, 80 mg or 150 mg, to the 56 subjects
Merkel <- data.frame(id=c(1:56), type = sample((rep(c("laMCC", "metMCC"), times =28))), response = c(30, sort(runif(n=53,min=-10,max=19), decreasing=TRUE),-25,-31), dose= sample(rep(c(80, 150), 28)))# Let's assign Best Overall Response (BOR)
Merkel$BOR= (c("PD", rep(c("SD"), times =54),"PR"))
head(Merkel)id   type response dose BOR
1  1 metMCC 30.00000  150  PD
2  2 metMCC 18.99641   80  SD
3  3  laMCC 18.78160   80  SD
4  4 metMCC 17.98778  150  SD
5  5 metMCC 16.61512   80  SD
6  6 metMCC 16.30297   80  SD
绘图
①根据剂量
##颜色设置
col <- ifelse(Merkel$dose == 80, "steelblue", # if dose = 80 mg, then the color will be steel blue"cadetblue") # if dose != 80 mg (i.e. 150 mg here), then the color will be cadet blue
MCC<- barplot(Merkel$response, col=col, border=col, space=0.5, ylim=c(-50,50),main = "Waterfall plot for Target Lesion Tumor Size", ylab="Change from baseline (%)",cex.axis=1.5, legend.text= c( "80mg", "150mg"),#添加图例args.legend=list(title="Treatment Dose", fill=c("steelblue", "cadetblue"), border=NA, cex=0.9))dev.off()

②根据type
col <- ifelse(Merkel$type == "laMCC", "#BC5A42", # if type of disease = locally MCC, then the color will be #BC5A42 (deep red)"#009296") # if type of disease != locaally MCC (i.e. mMCC), then the color will be ##009296 (greenish-blue)MCC<- barplot(Merkel$response, col=col, border=col, space=0.5, ylim=c(-50,50),main = "Waterfall plot for Target Lesion Tumor Size", ylab="Change from baseline (%)",cex.axis=1.5, legend.text= c( "locally advanced MCC", "Metastatic MCC"),args.legend=list(title="Disease", fill=c("#BC5A42", "#009296"), border=NA, cex=0.9))

③根据治疗响应度
col <- ifelse(Merkel$BOR == "CR", "green", # if a subject had a CR the bar will be green, if they did not have a CR....ifelse(Merkel$BOR == "PR", "steelblue", # then, if a subject had a PR the bar will be steel blue, if they did not have a PR or CR....ifelse(Merkel$BOR == "PD", "red", # then, if a subject had a PD the bar will be red, otherwise if they did not have a PR or CR or PD.... ifelse(Merkel$BOR == "SD", "cadetblue", # then they must have ahd a SD, so the bar will be cadetblue, otherwise...."") # the color will be blank (which is not really an option, b/c they must have either a CR, PR, PD or SD))))MCC<- barplot(Merkel$response, col=col, border=col, space=0.5, ylim=c(-50,50),main = "Waterfall plot for Target Lesion Tumor Size", ylab="Change from baseline (%)",cex.axis=1.5, legend.text= c( "CR: Complete Response", "PR: Partial Response", "SD: Stable Disease", "PD: Progressive Disease"),args.legend=list(title="Best Overall Response", fill=c("green","steelblue", "cadetblue", "red"), border=NA, cex=0.9))
添加水平线
abline(h=20, col = "black", lwd=0.5) # The "PD" line
abline(h=-30, col = "black", lwd=0.5) # This "PR" line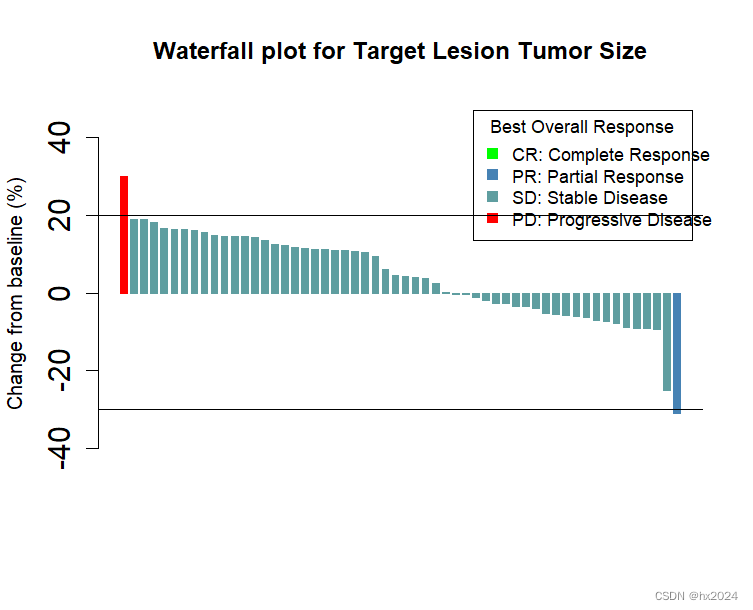
来源:
The Miller Lab - Visualizing Tumor Response using Waterfall Charts with R
