Promethues是可以单机搭建的,参考prometheus入门[1]
本文是就Promethues+Grafana在K8s环境下的搭建及配置
Prometheus度量指标监控平台简介
-
启动minikube
minikube start -
安装helm
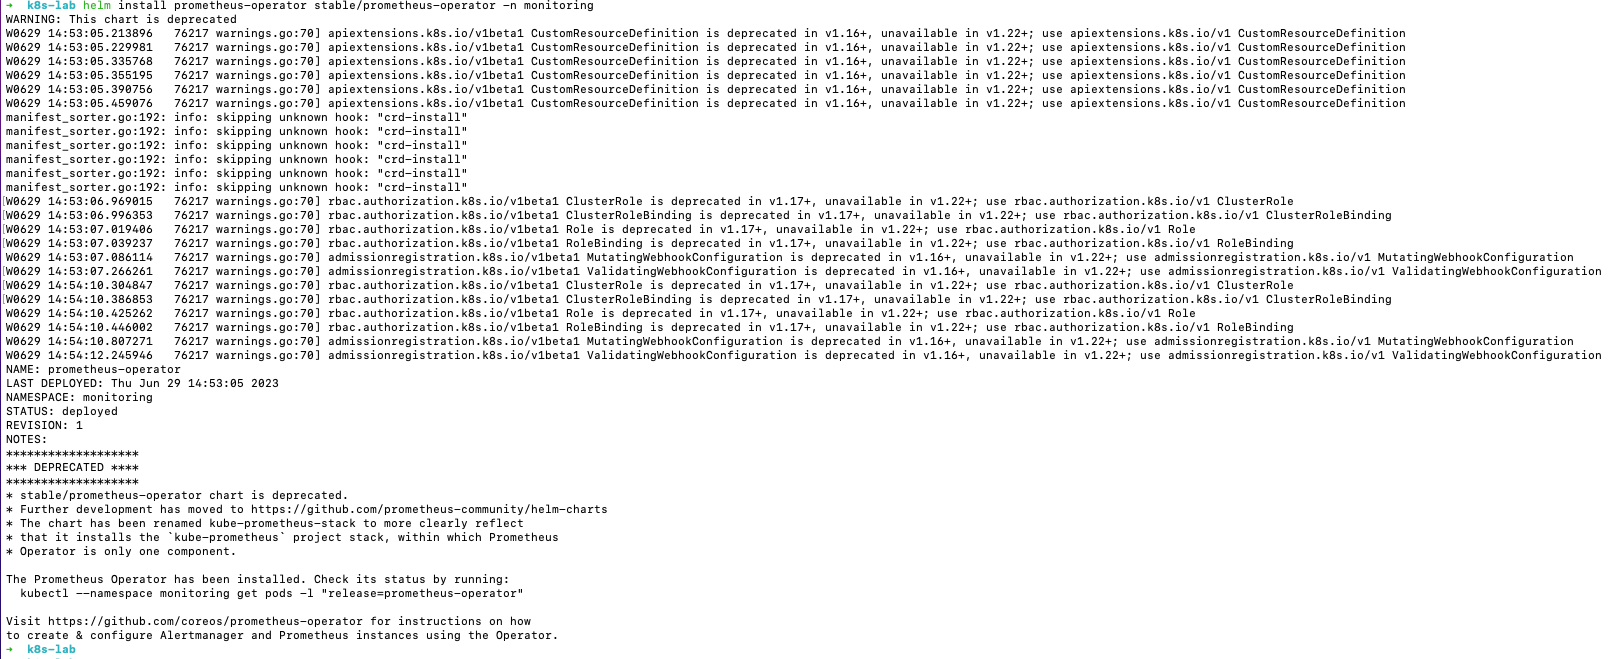
使用Helm Chart 安装 Prometheus Operator:
helm install prometheus-operator stable/prometheus-operator -n monitoring
报错:
WARNING: This chart is deprecated
Error: INSTALLATION FAILED: failed to install CRD crds/crd-alertmanager.yaml: resource mapping not found for name: "alertmanagers.monitoring.coreos.com" namespace: "" from "": no matches for kind "CustomResourceDefinition" in version "apiextensions.k8s.io/v1beta1"
ensure CRDs are installed first
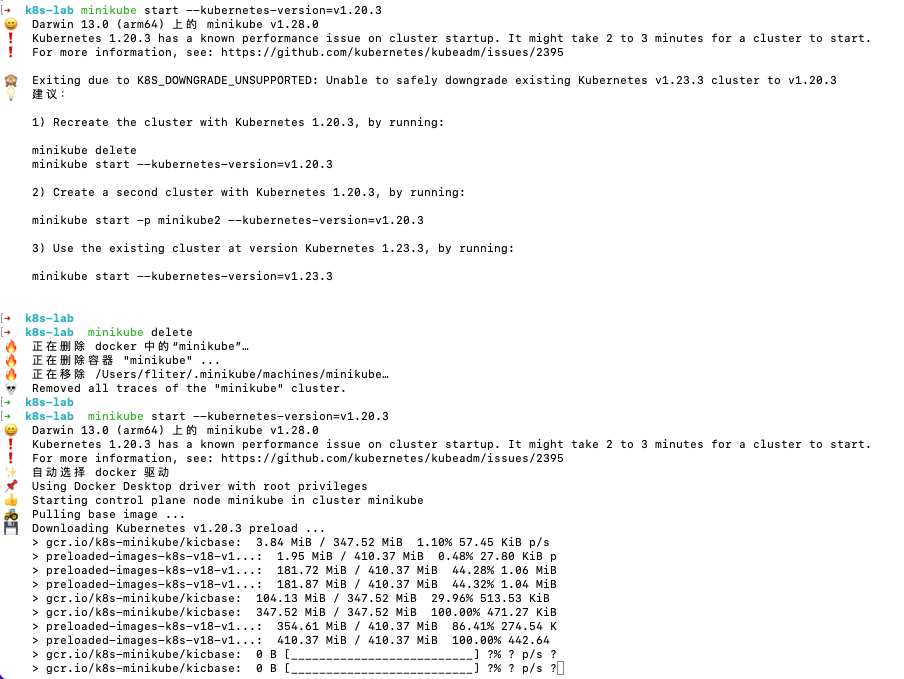
根据 Kubernetes和微服务监控体系[2](搜索"降低我们的版本")
降低minikube版本: minikube start --kubernetes-version=v1.20.3
(这步可能会卡着不动等半天,耐心等待即可~)
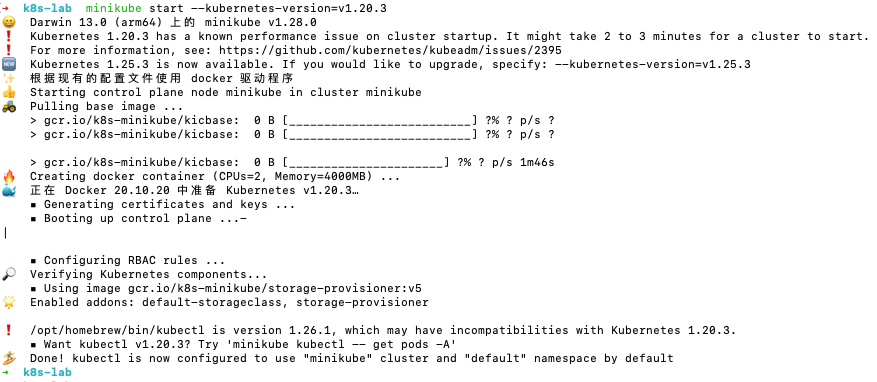
解决该问题后继续:
kubectl create ns monitoring
helm install prometheus-operator stable/prometheus-operator -n monitoring
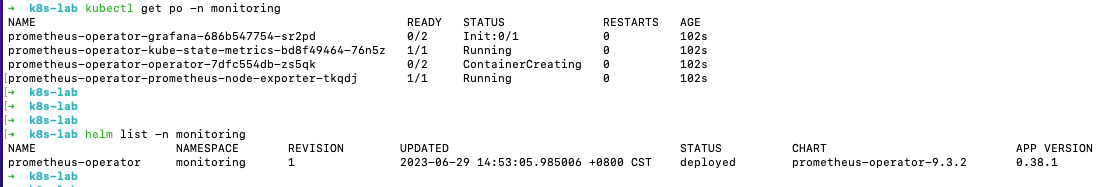
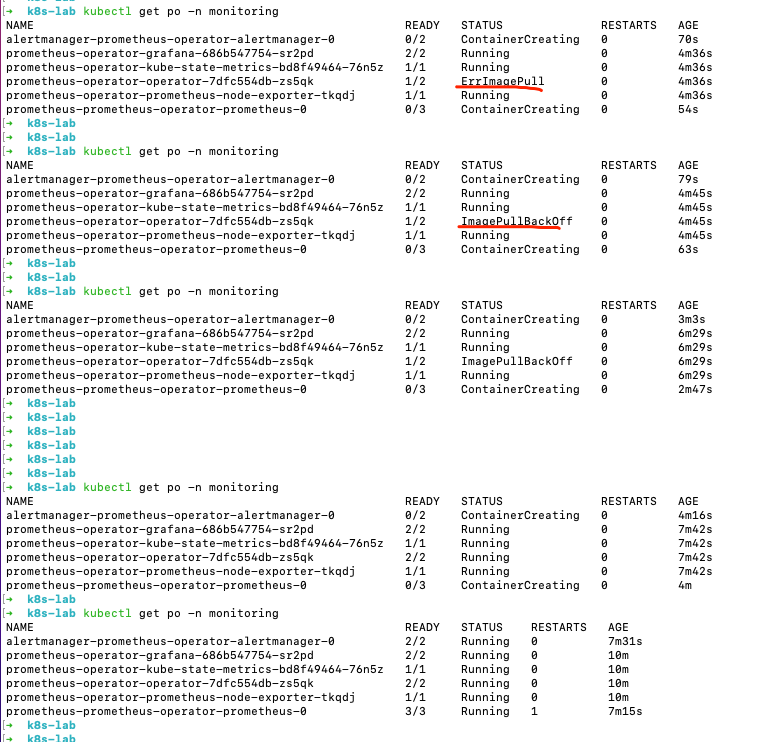
要等一会儿,全部pod才能都启动起来~
Promethues-Operator基本功能展示
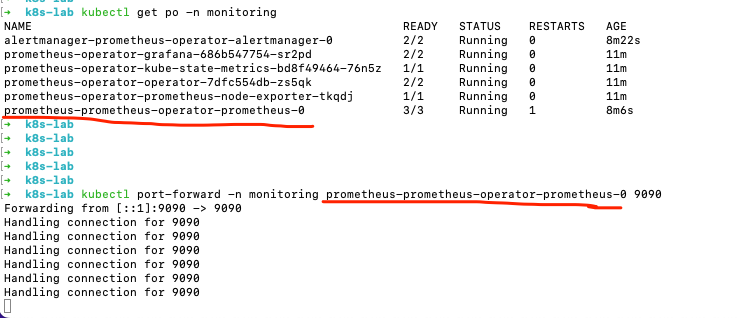
访问prometheus内置浏览器
kubectl port-forward -n monitoring prometheus-prometheus-operator-prometheus-0 9090
kubectl port-forward 什么意思?
kubectl port-forward 是一个 Kubernetes 命令,用于将本地端口与 Kubernetes Pod 或 Service 的端口之间建立临时的网络转发连接。
当你在本地开发环境中需要直接访问运行在 Kubernetes 集群中的 Pod 或 Service 时,kubectl port-forward 命令可以帮助你在本地主机和 Kubernetes 集群之间建立一个网络通道。
使用 kubectl port-forward 命令时,你需要指定要转发的资源类型和名称,并指定本地端口和远程端口。例如,以下命令将本地的 8080 端口与名为 "my-pod" 的 Pod 的 80 端口进行转发:
kubectl port-forward my-pod 8080:80
这将在本地主机的 8080 端口上启动一个转发服务,将所有发送到该端口的请求转发到运行在 "my-pod" Pod 中的 80 端口。你可以使用本地浏览器或工具访问 localhost:8080 来与 Pod 进行交互。
类似地,你也可以使用 kubectl port-forward 命令转发到 Service 的端口。例如:
kubectl port-forward service/my-service 8080:80
这将将本地的 8080 端口与名为 "my-service" 的 Service 的 80 端口进行转发。
kubectl port-forward 命令对于在本地开发和调试过程中与 Kubernetes 集群中的资源进行交互非常有用。它可以方便地将远程服务映射到本地主机,以便你可以直接访问和测试它们。
访问 http://localhost:9090/
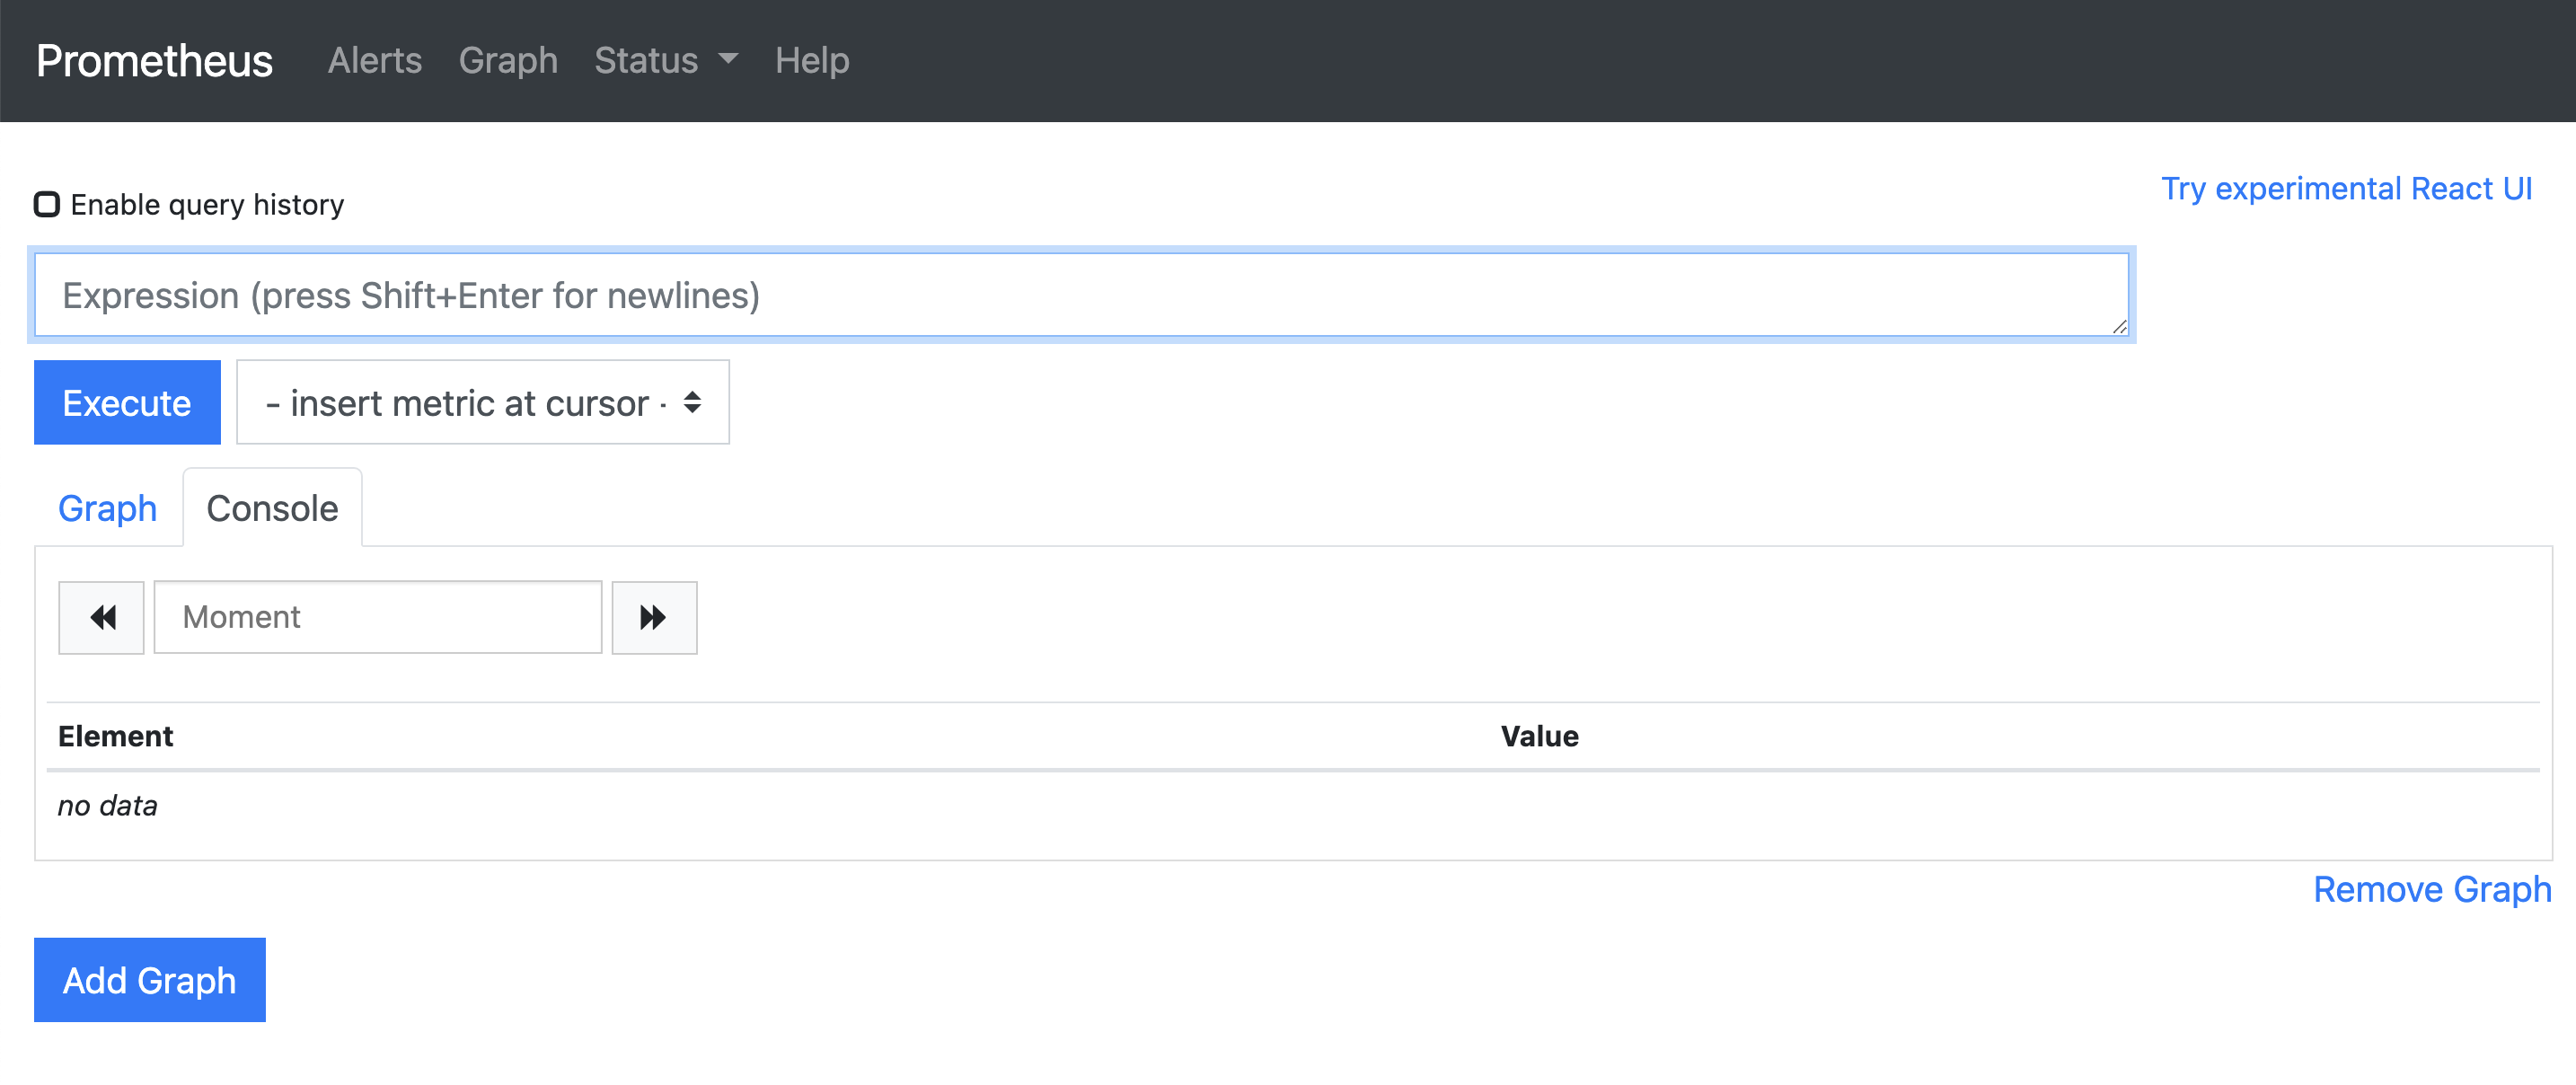
prometheus-operator 已经帮我们把相关的监控项配置好了
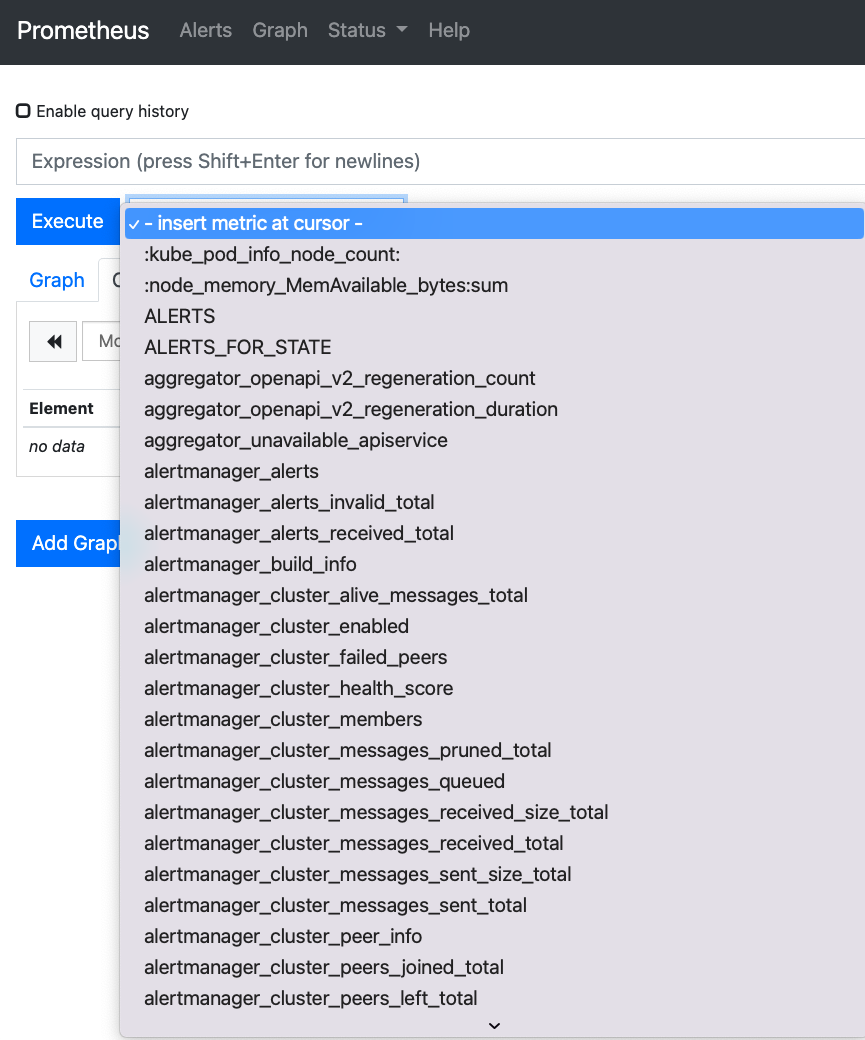
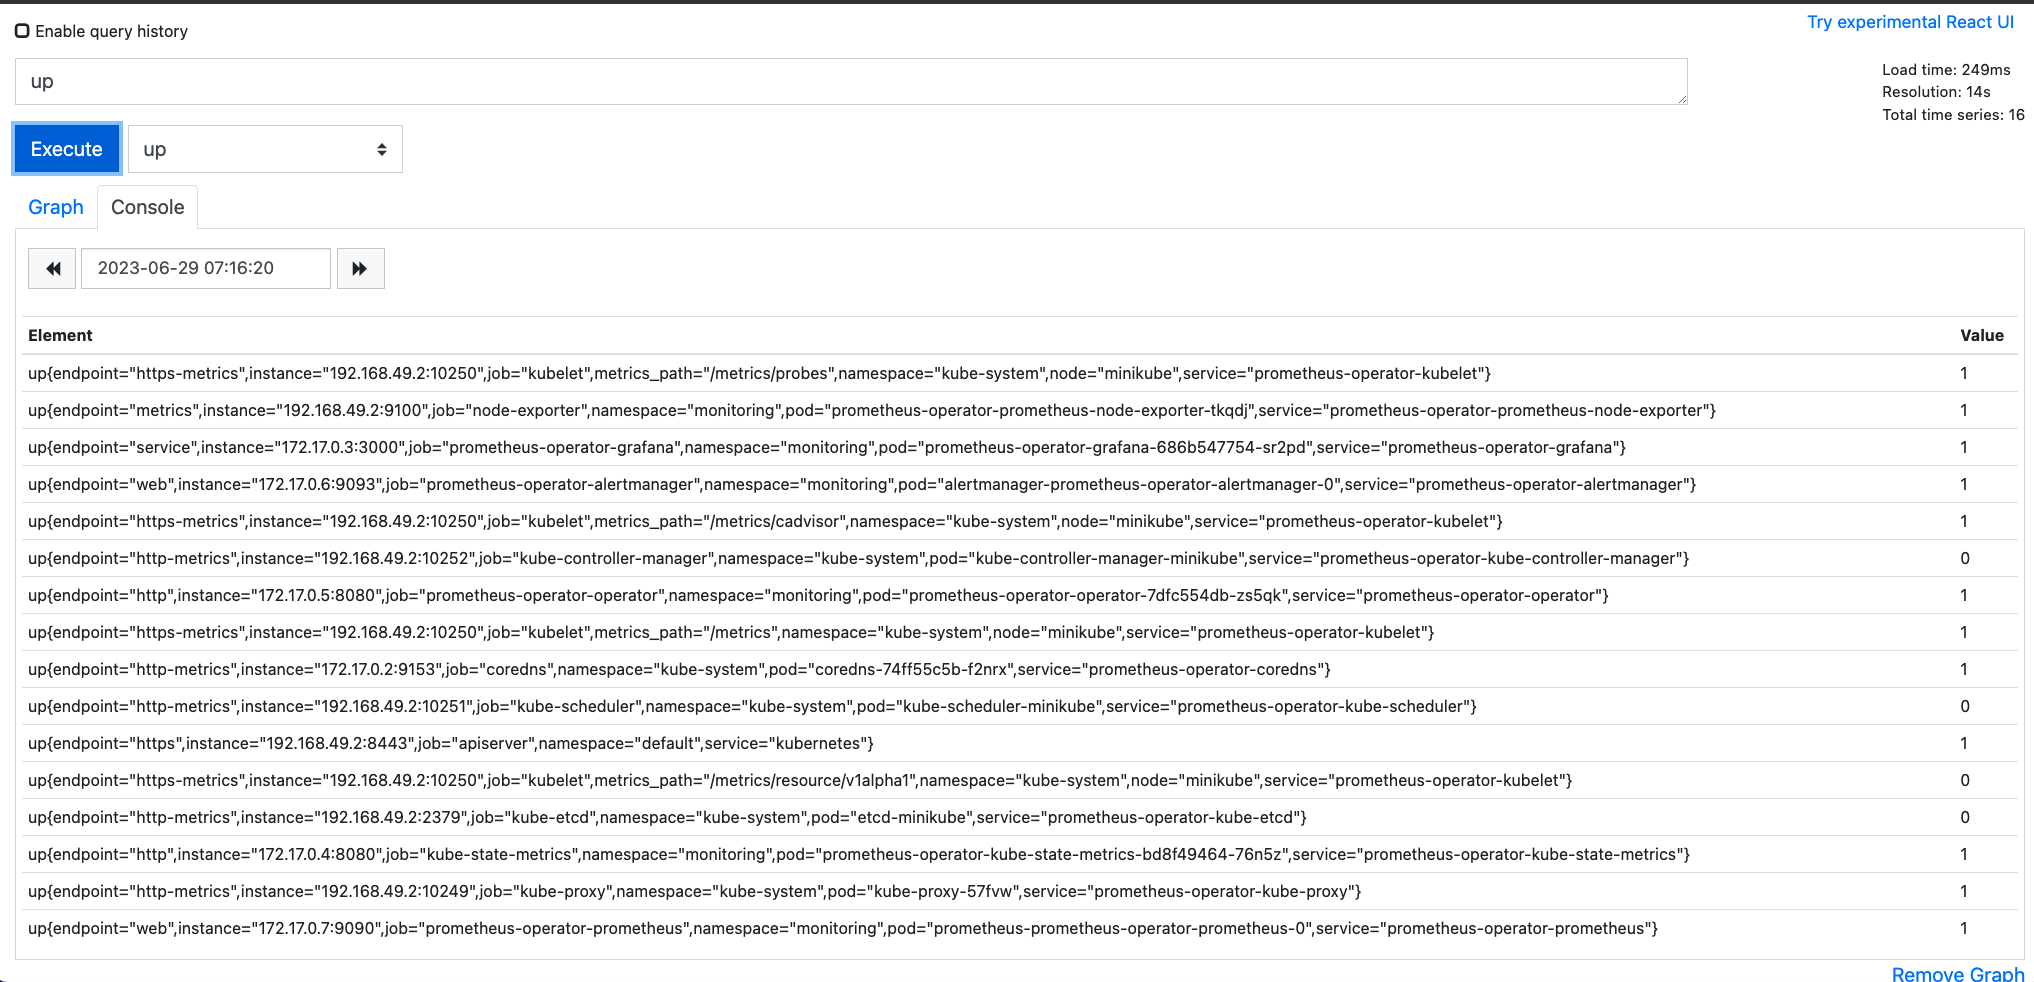
up指标
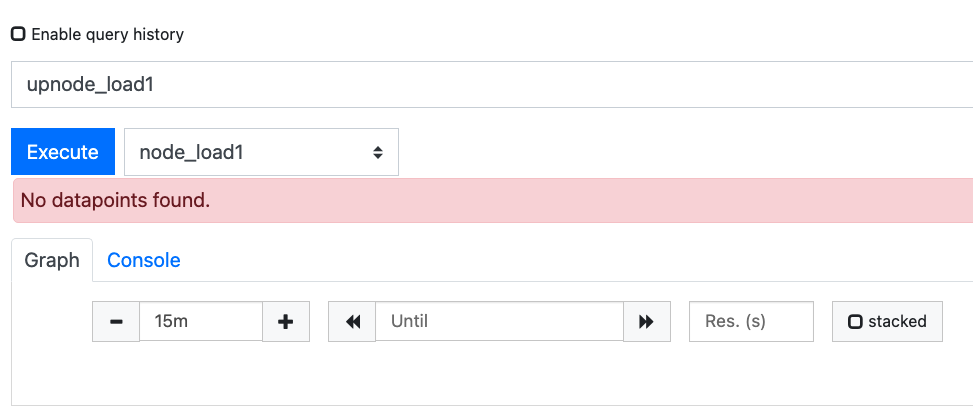
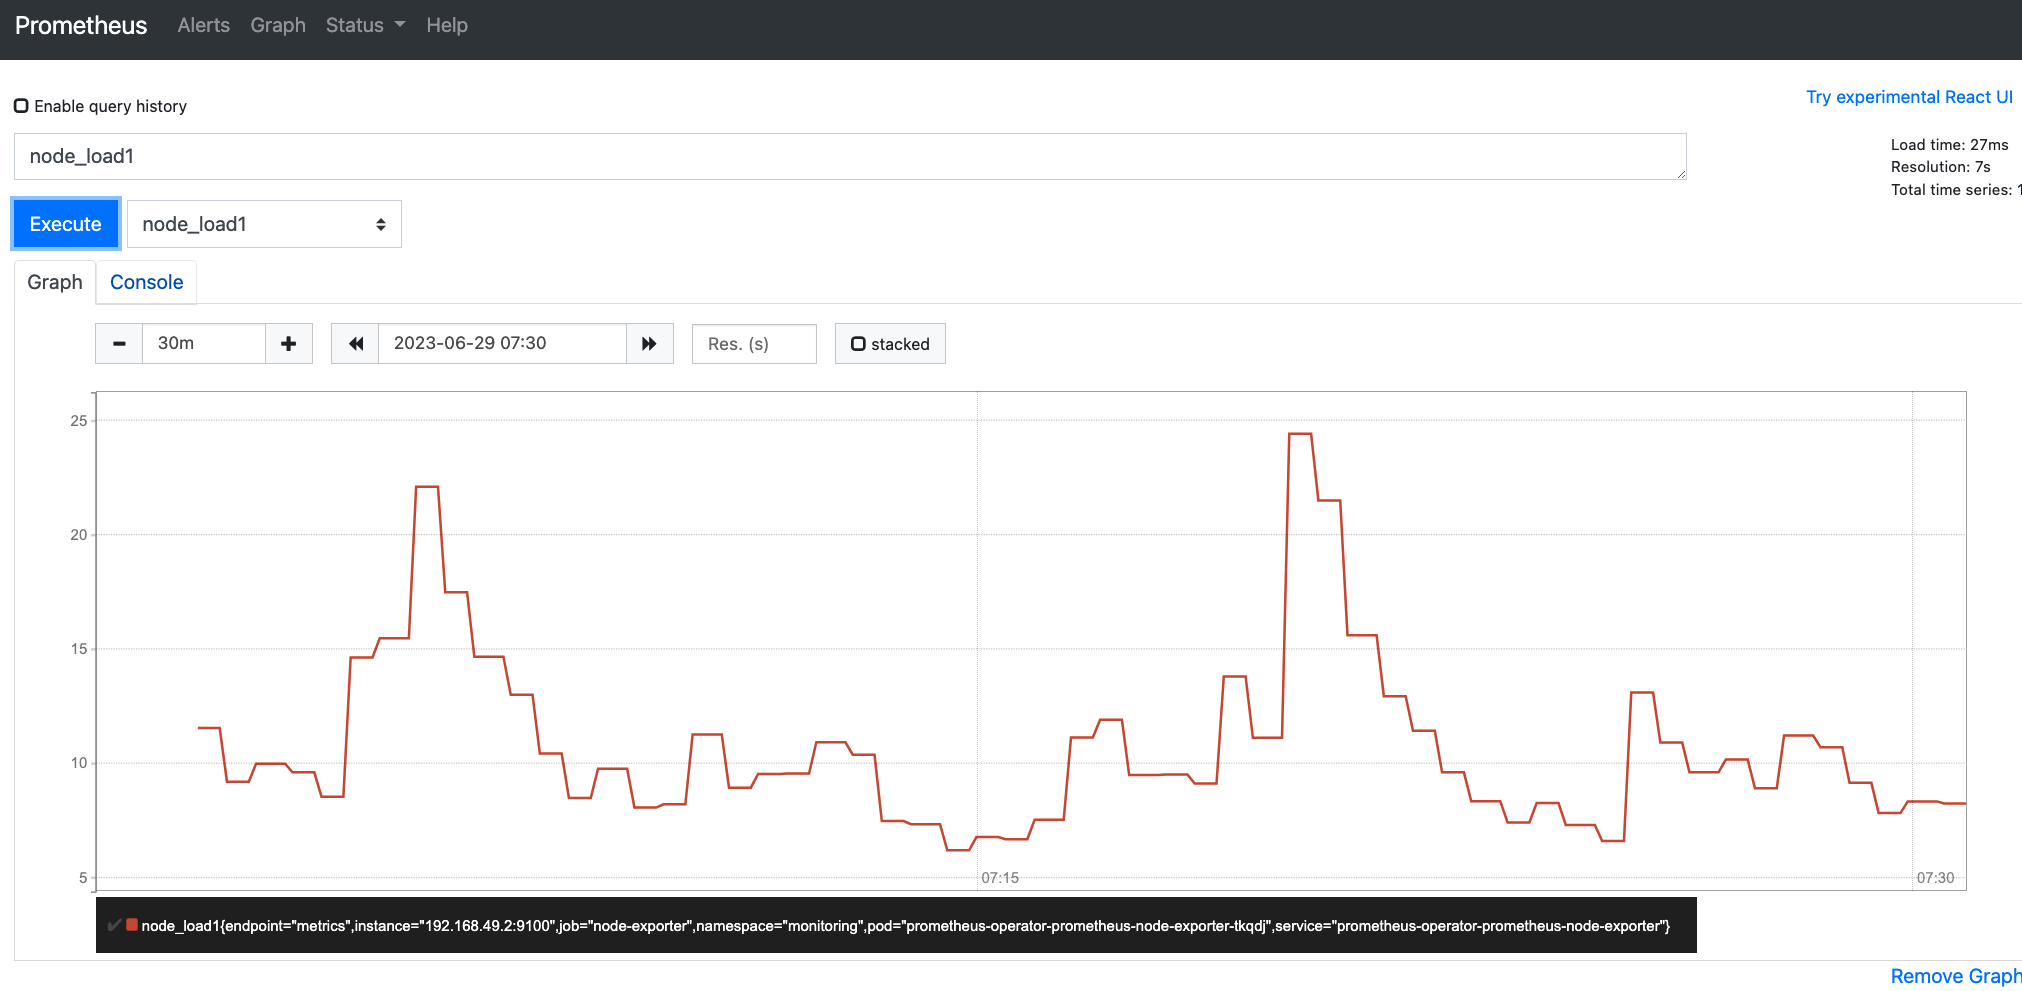
node_load1指标
No datapoints found. , issue[3]
但好像没干啥就好了..
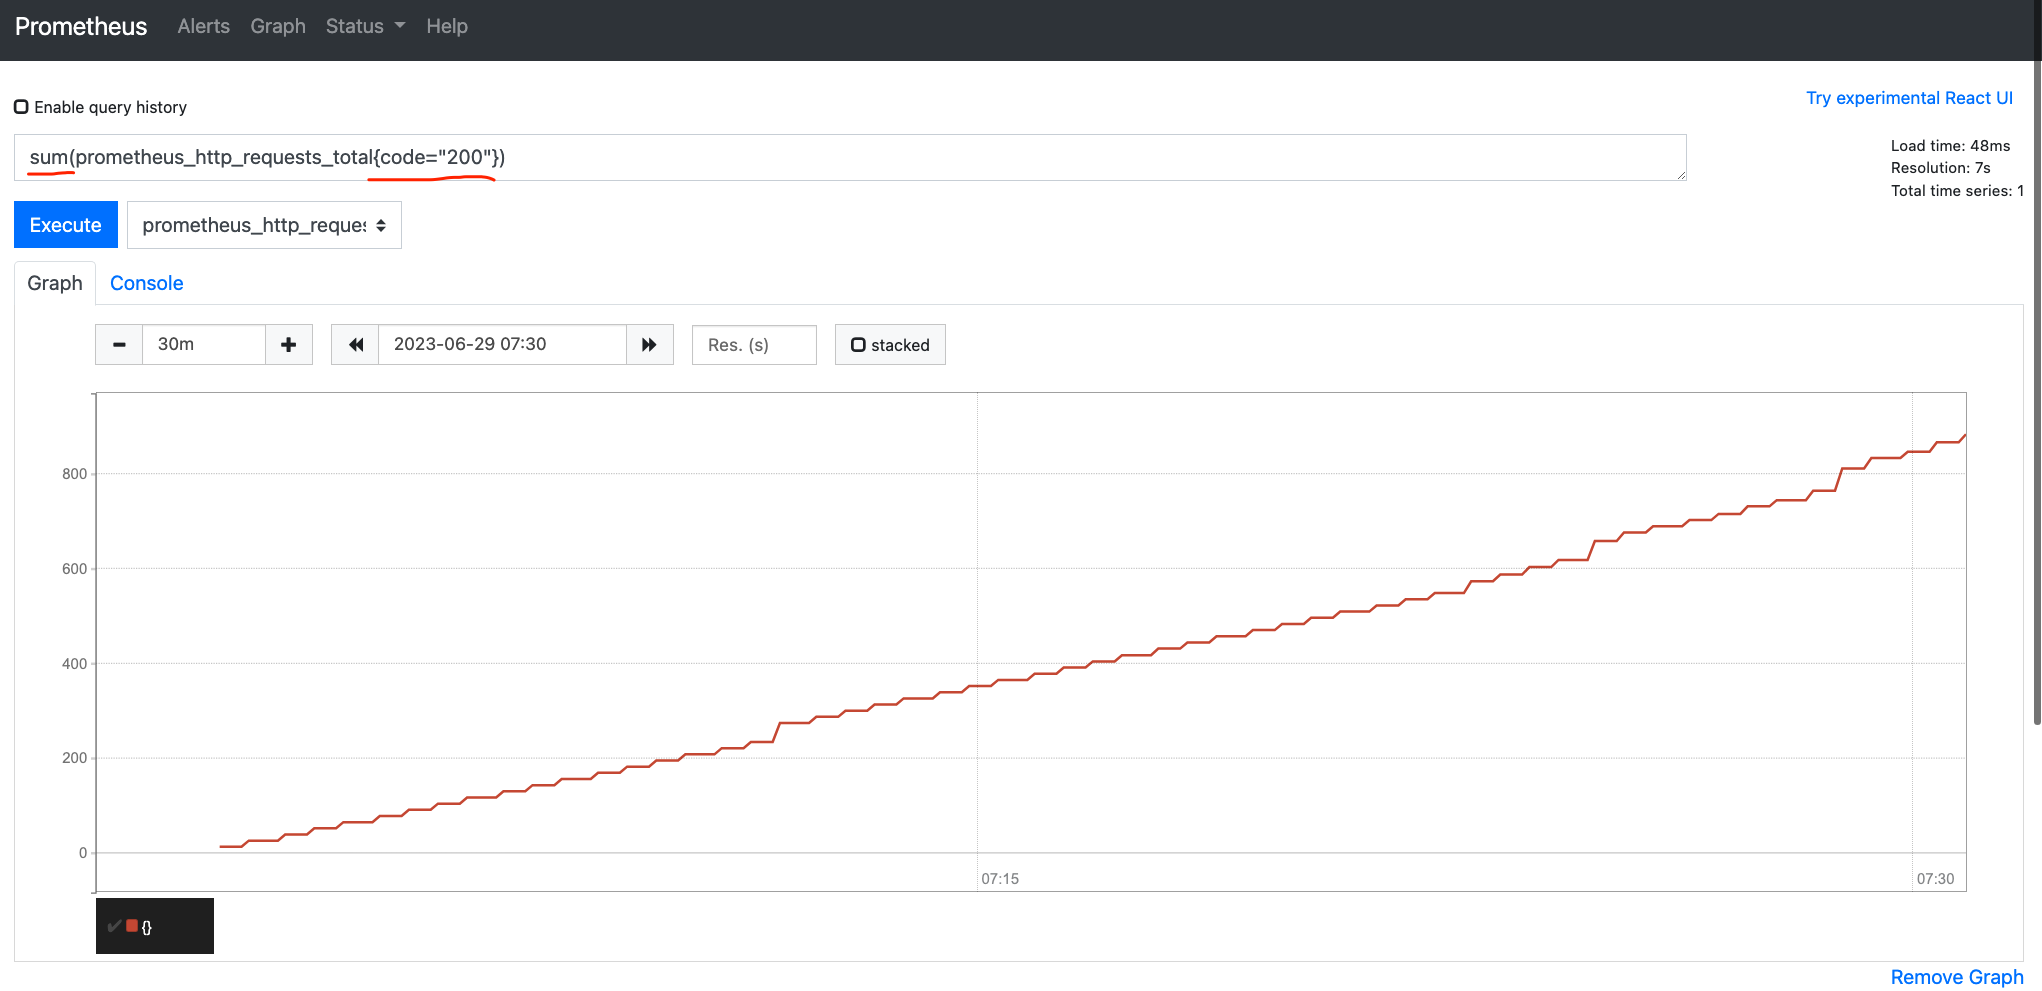
查询对promethues web总的成功请求数
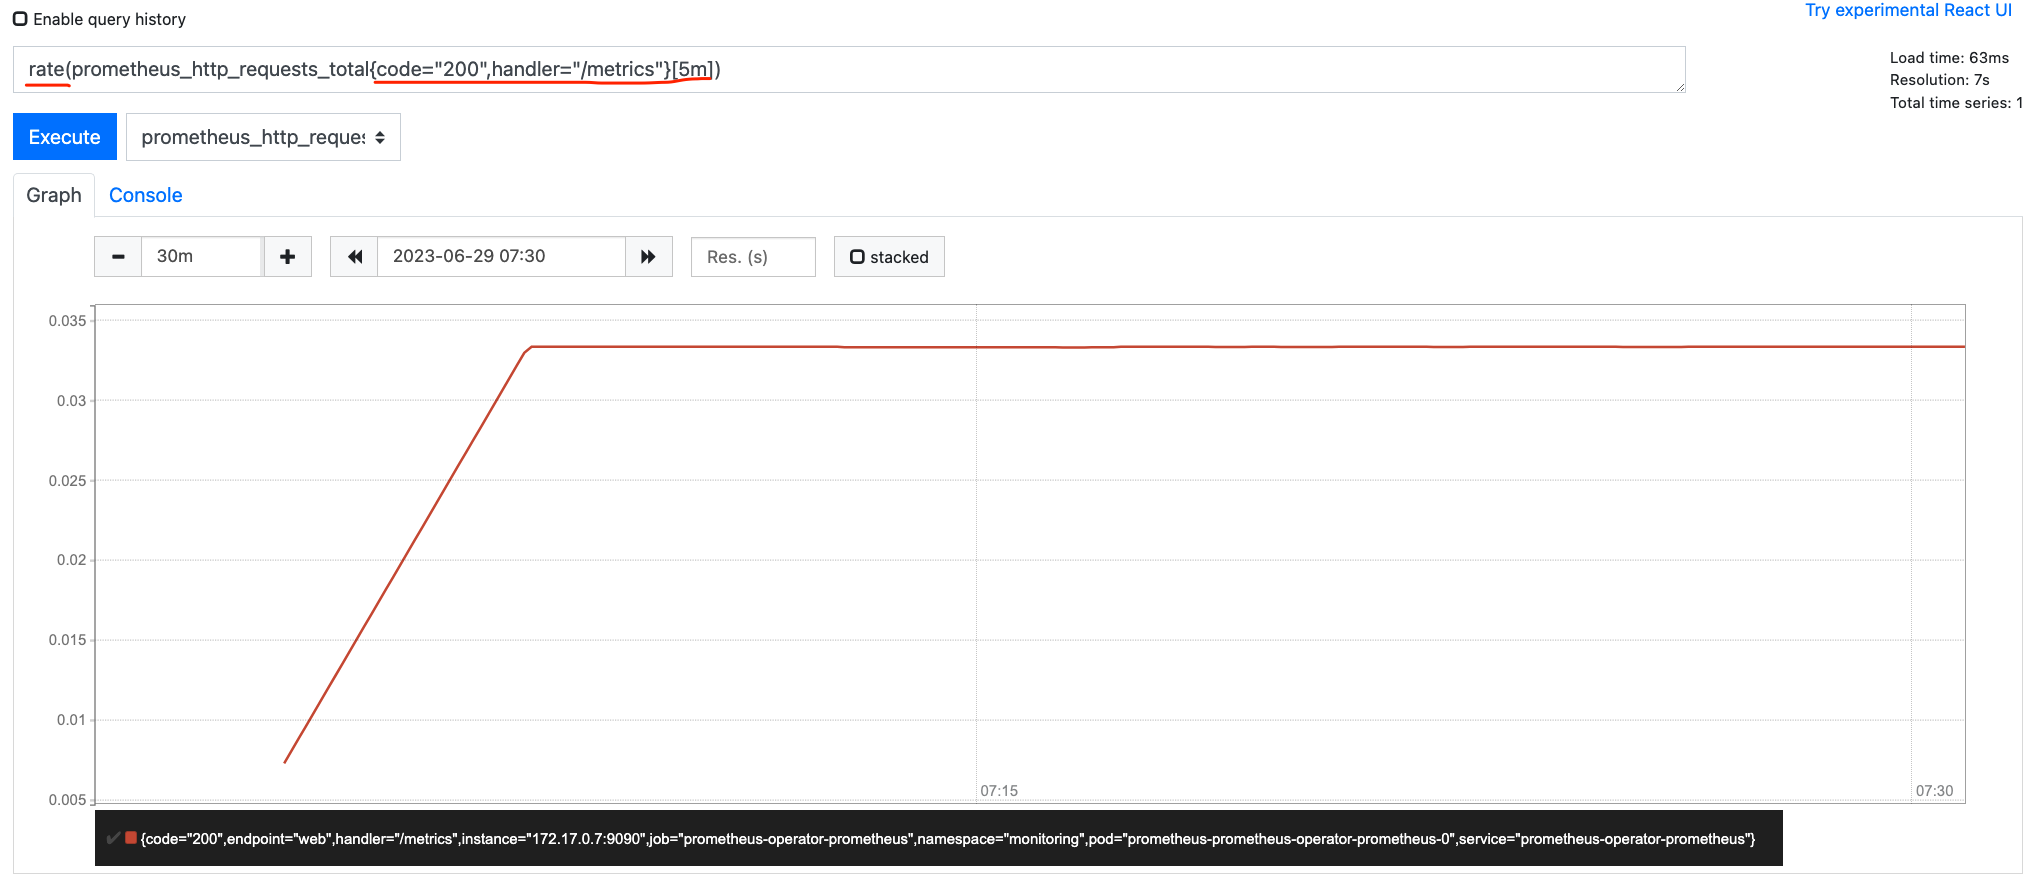
查询对promethues metrics端点的成功请求率
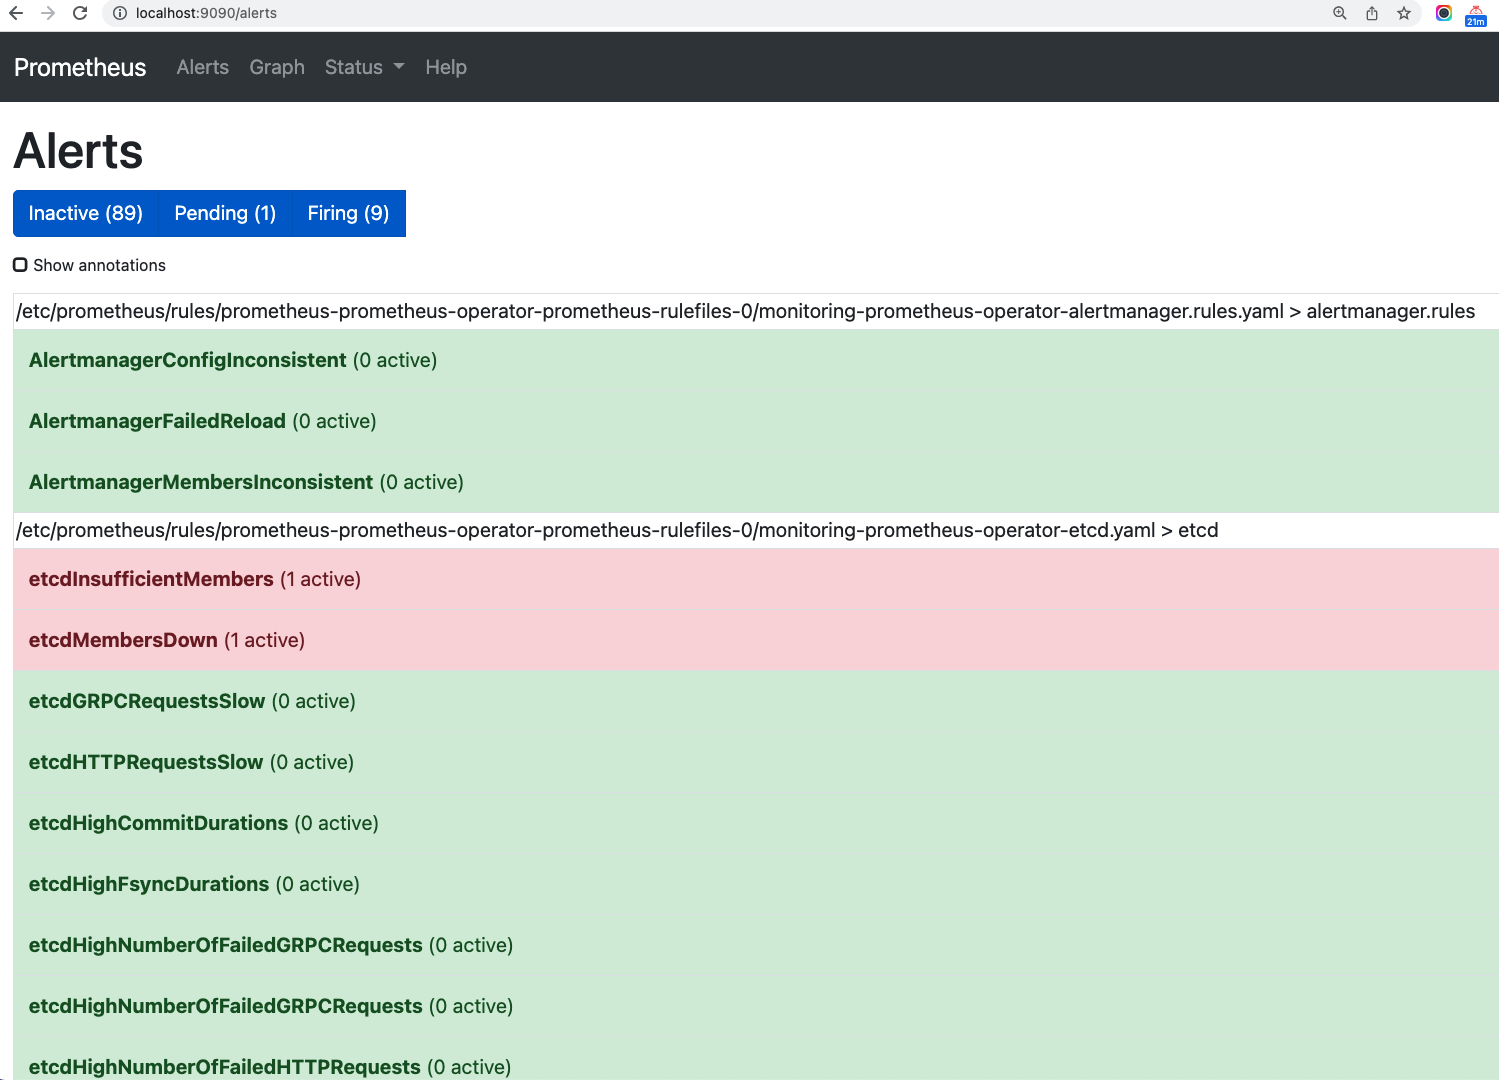
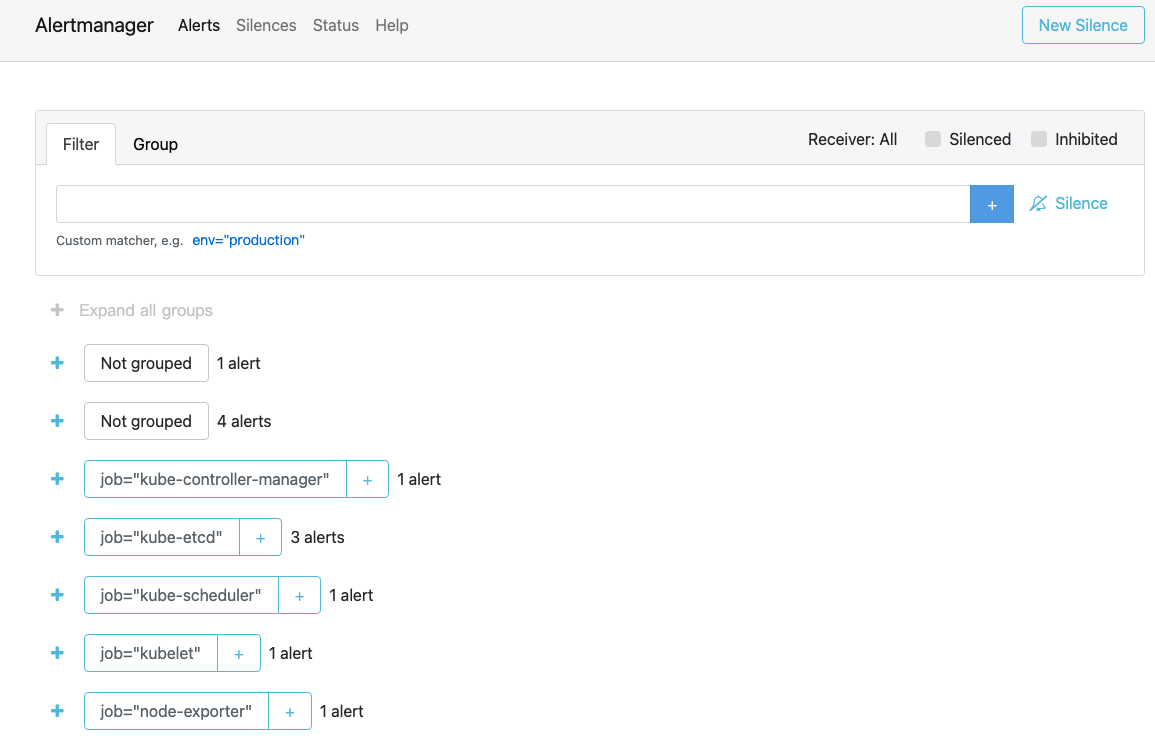
告警信息
http://localhost:9090/alerts
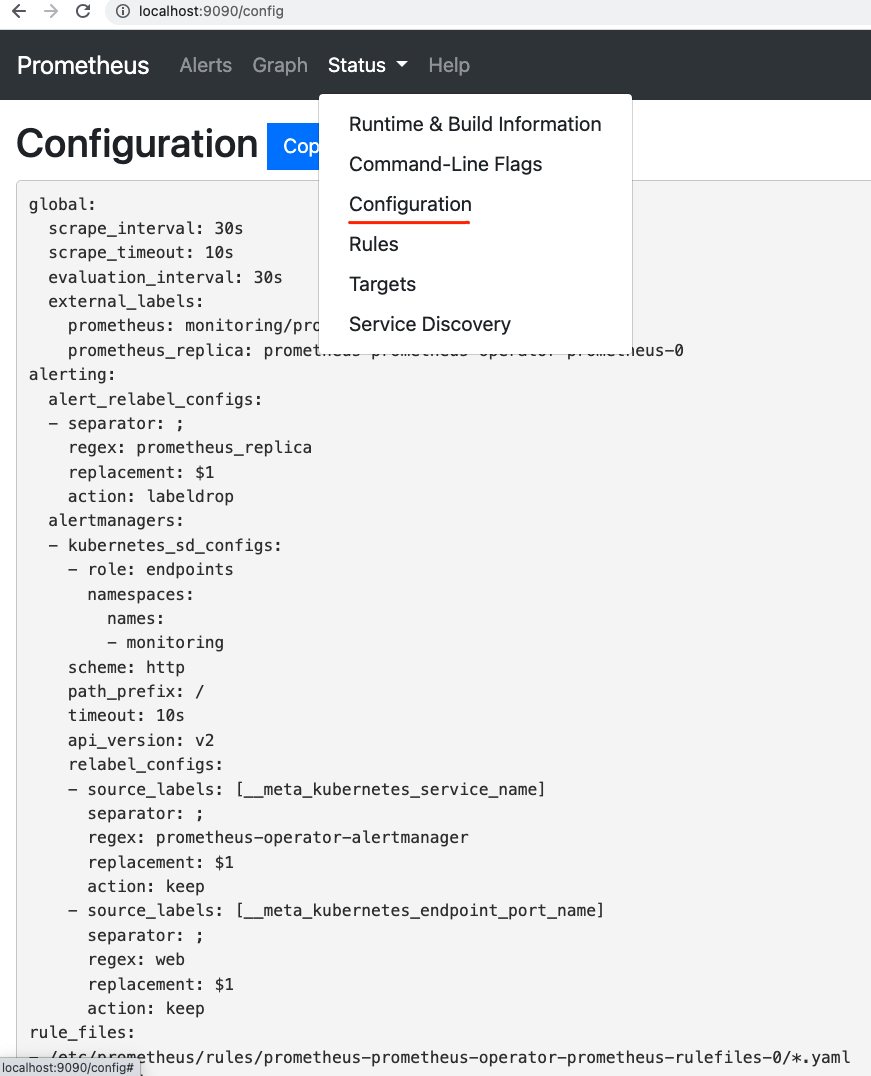
配置信息Configuration
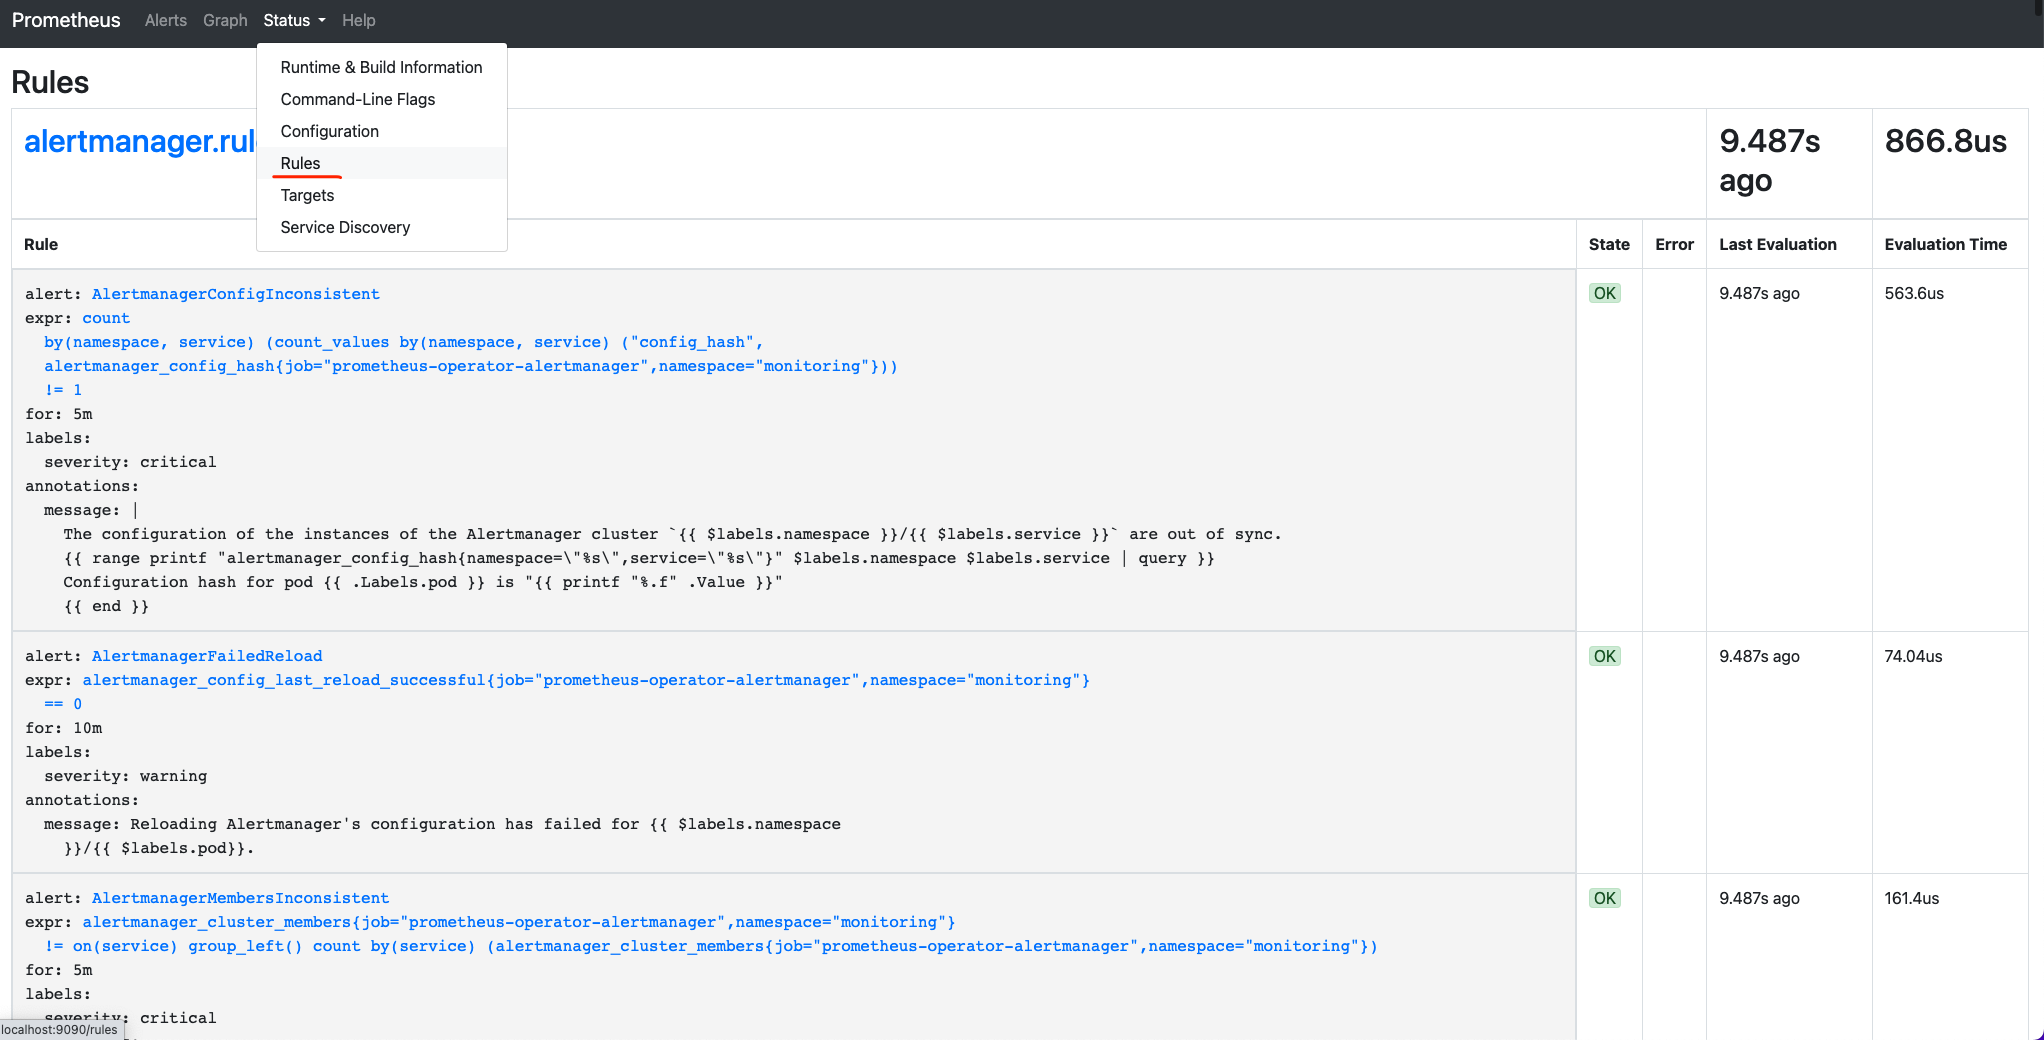
告警(alert)和聚合(record)规则Rules
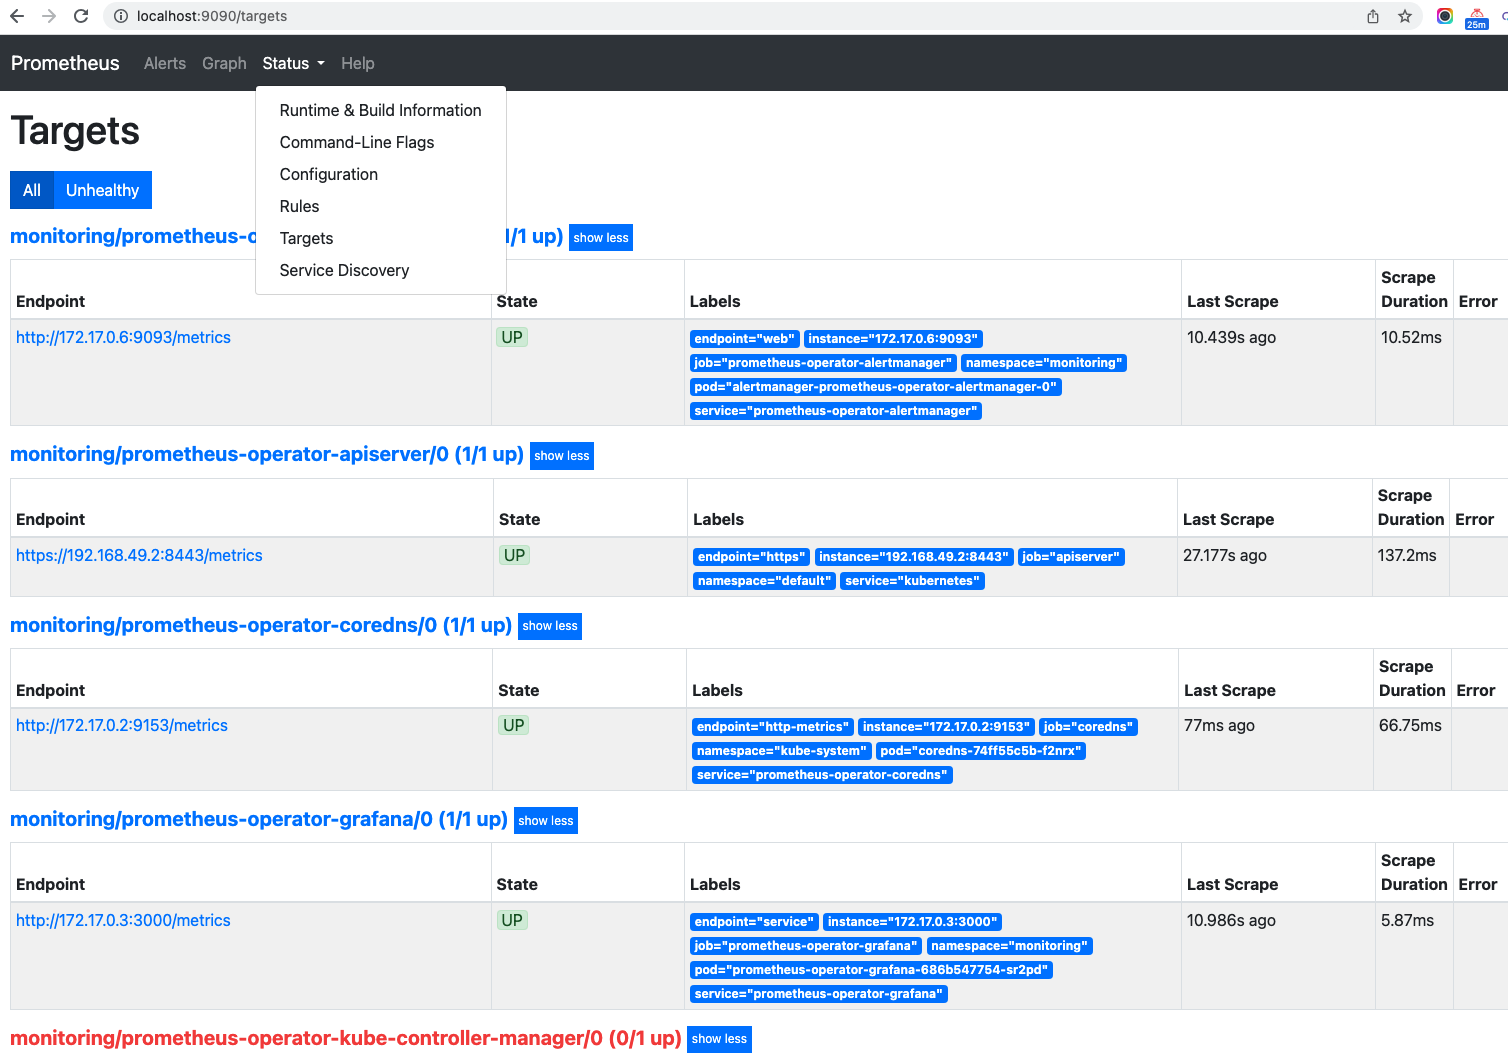
监控目标Targets
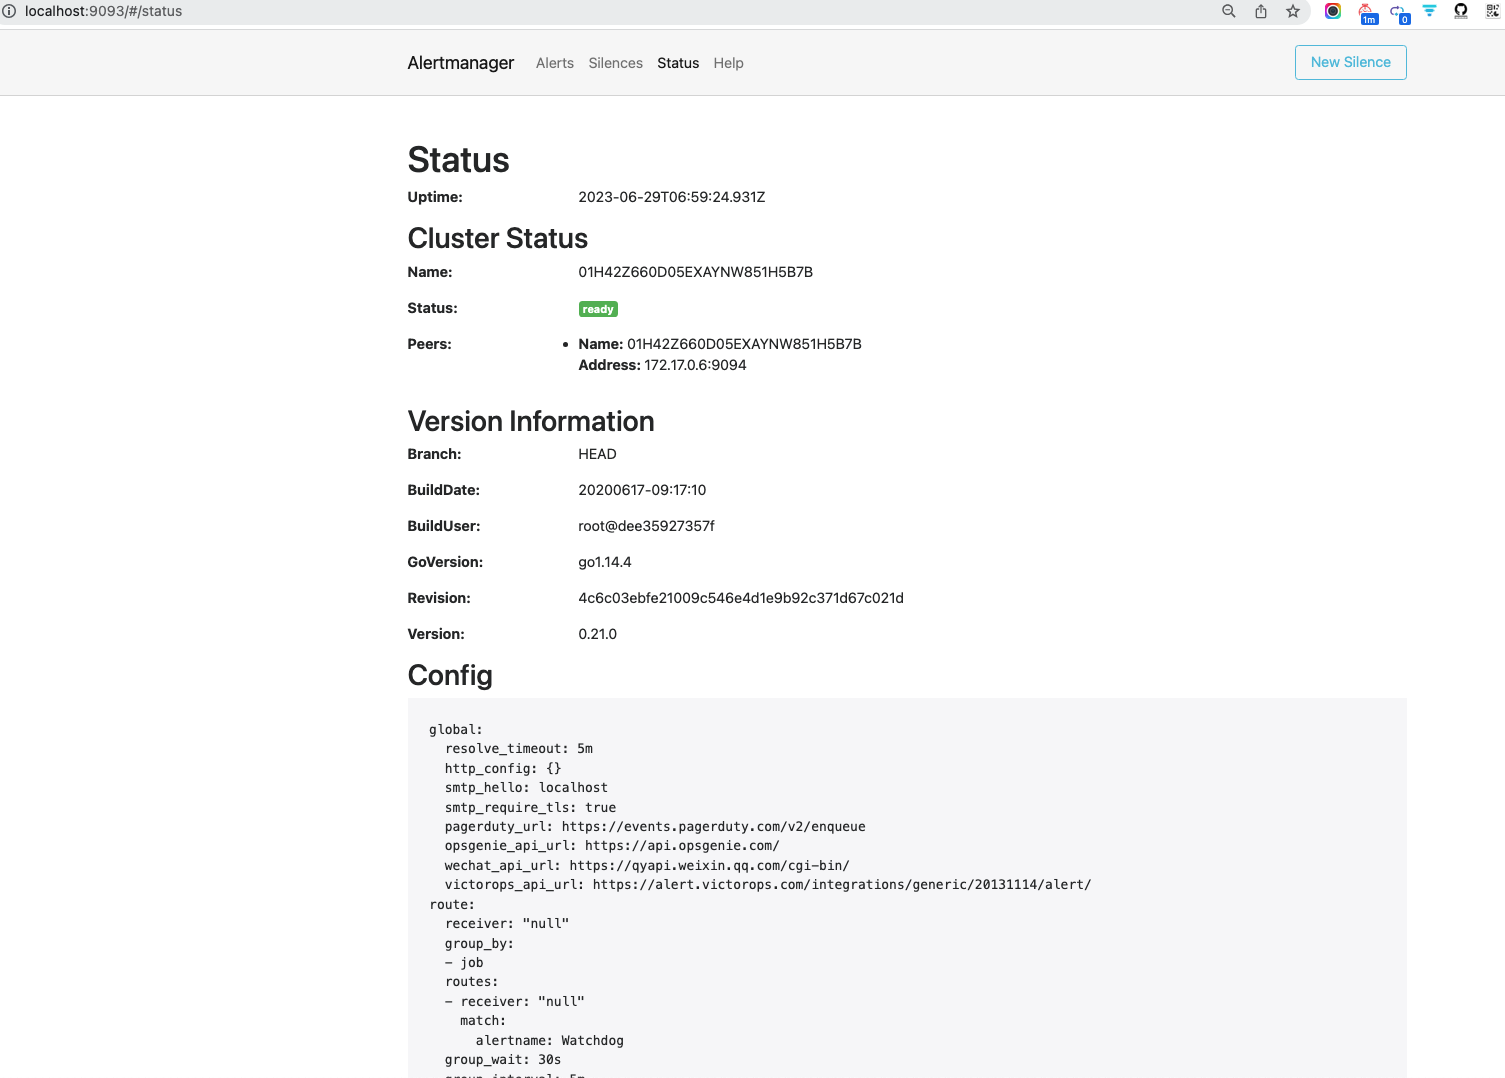
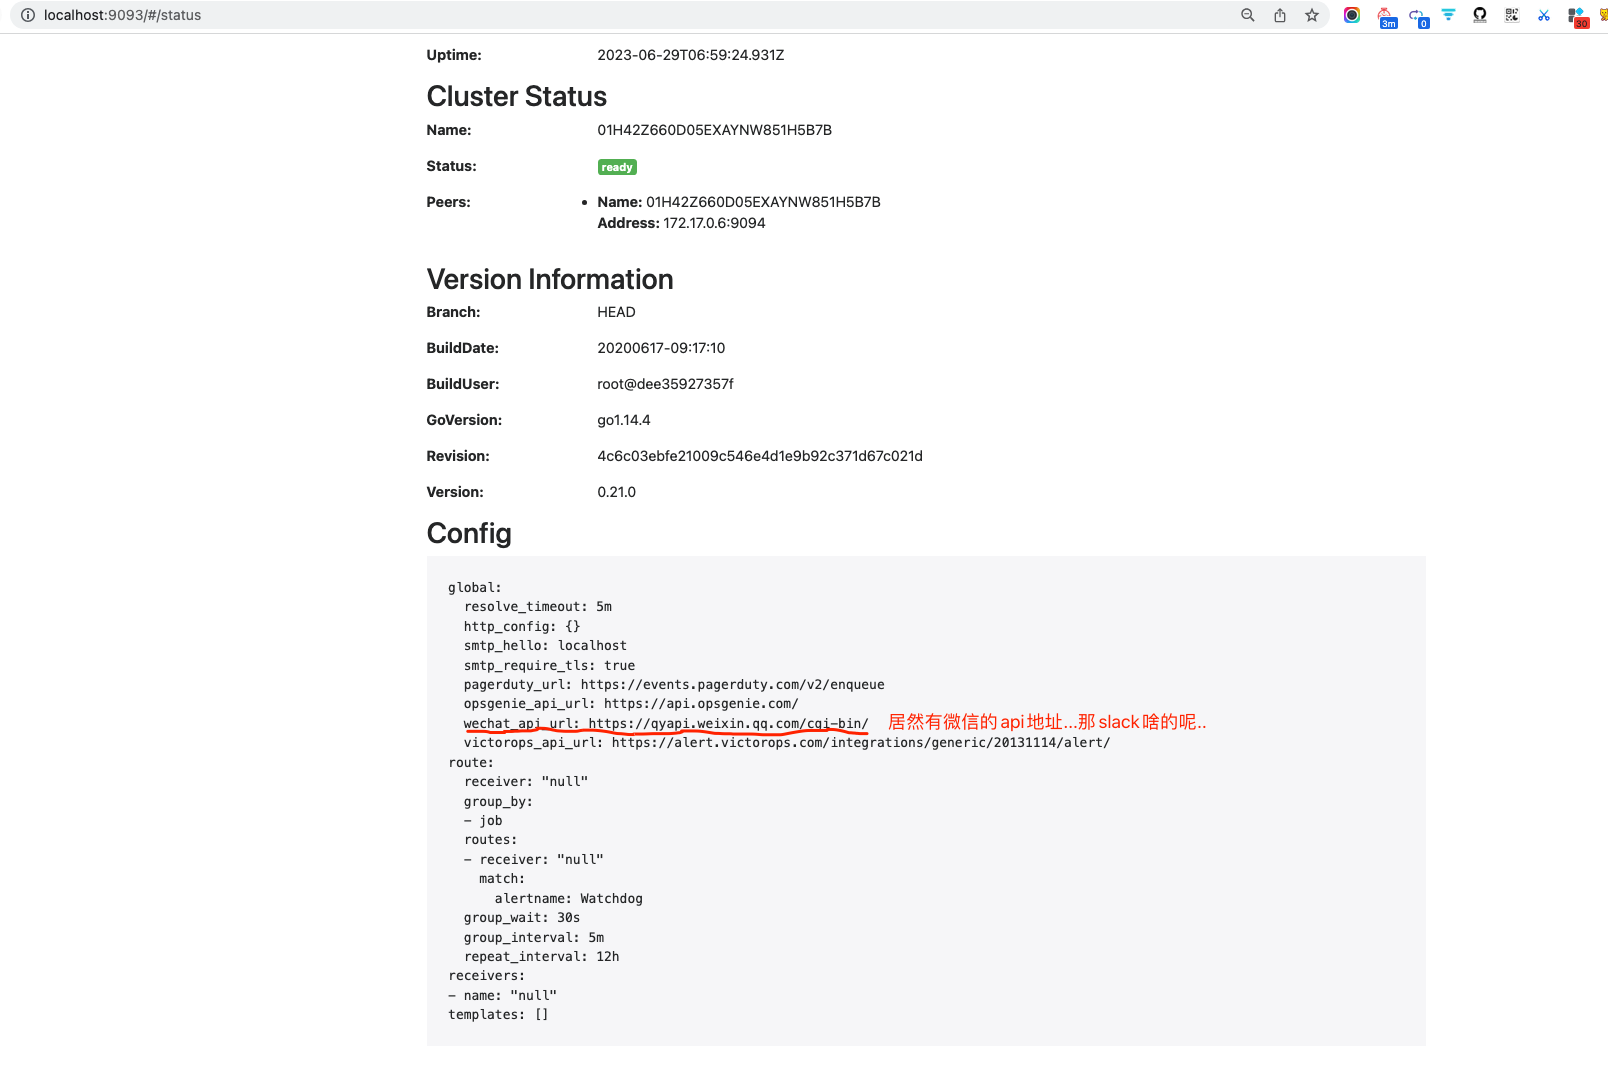
访问Alertmanger UI
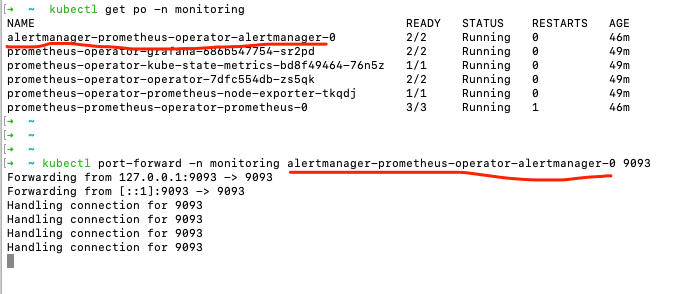
kubectl port-forward -n monitoring alertmanager-prometheus-operator-alertmanager-0 9093
告警信息
状态和配置
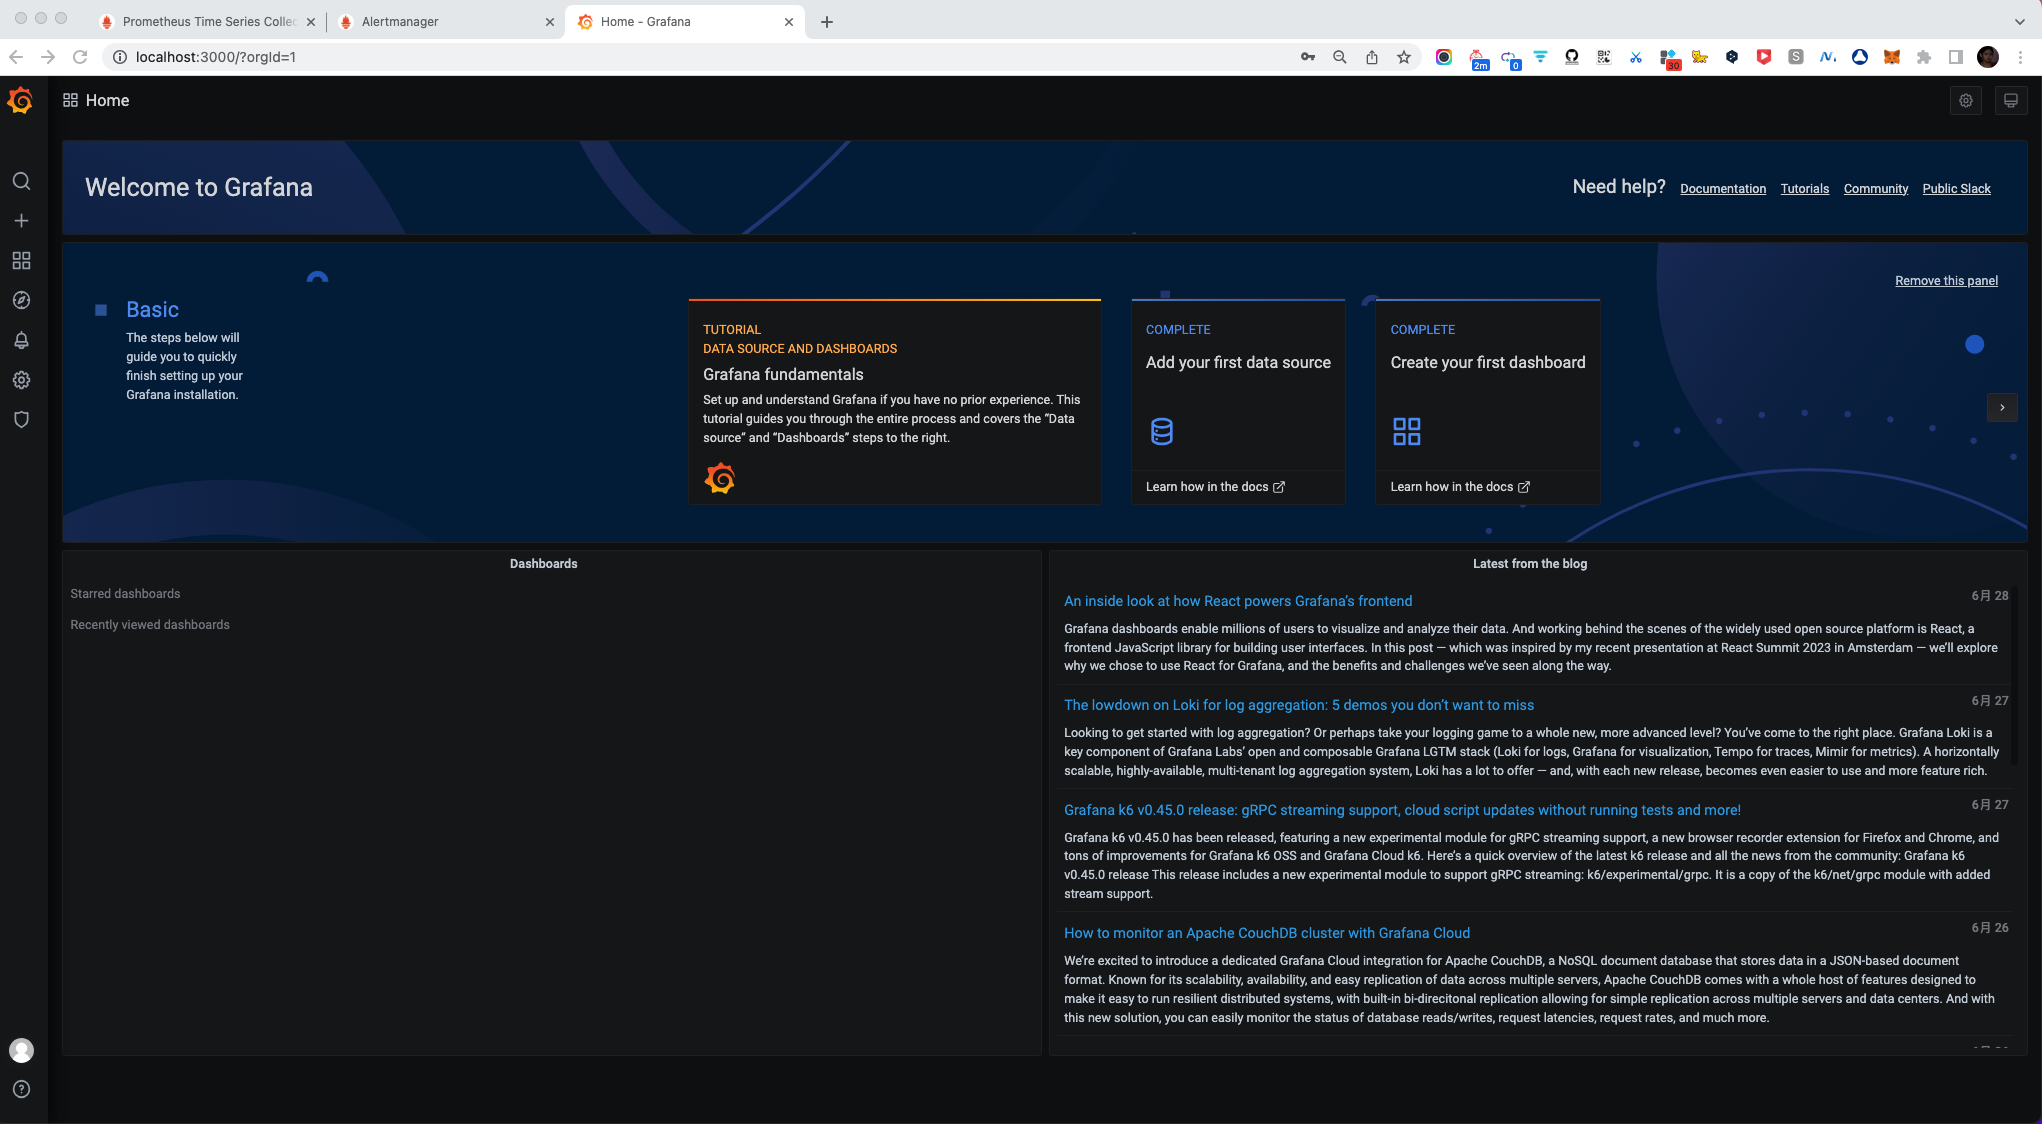
访问Grafana UI
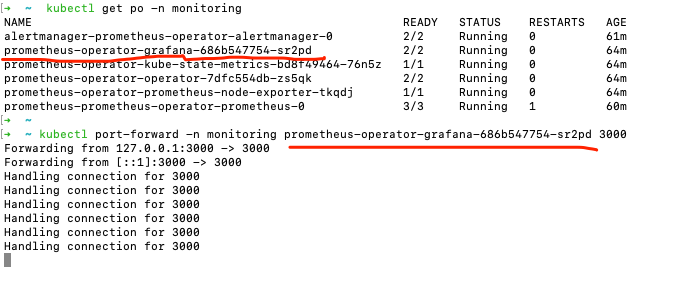
http://localhost:3000/
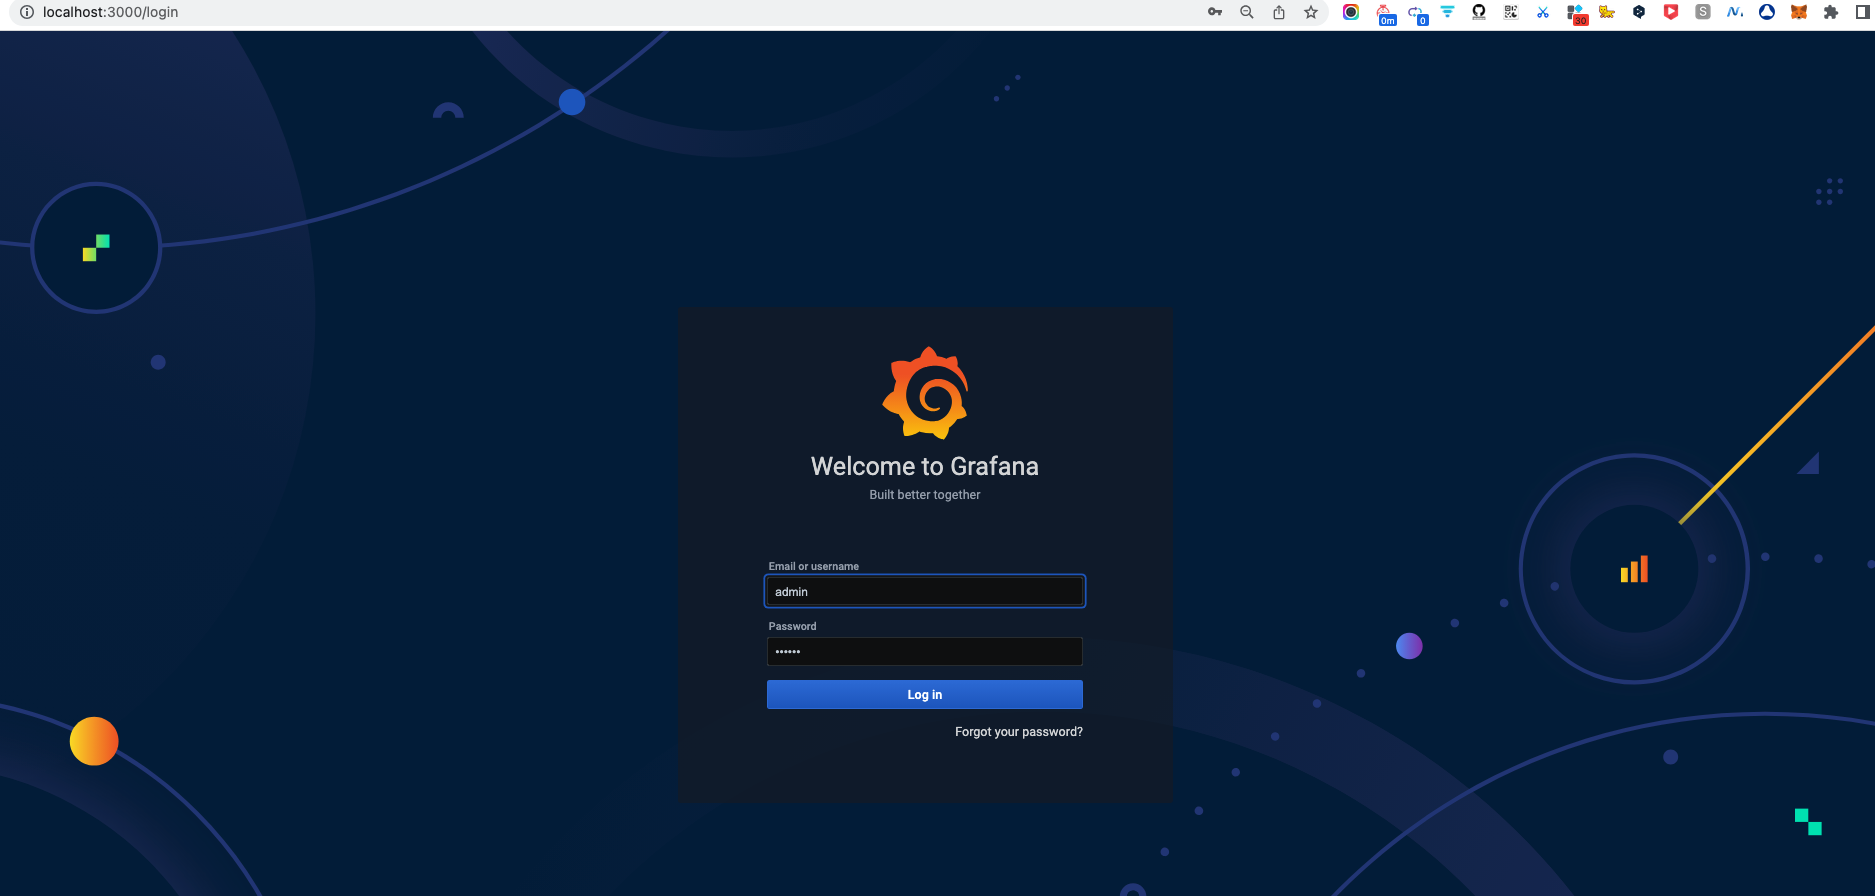
user: admin
pass: prom-operator
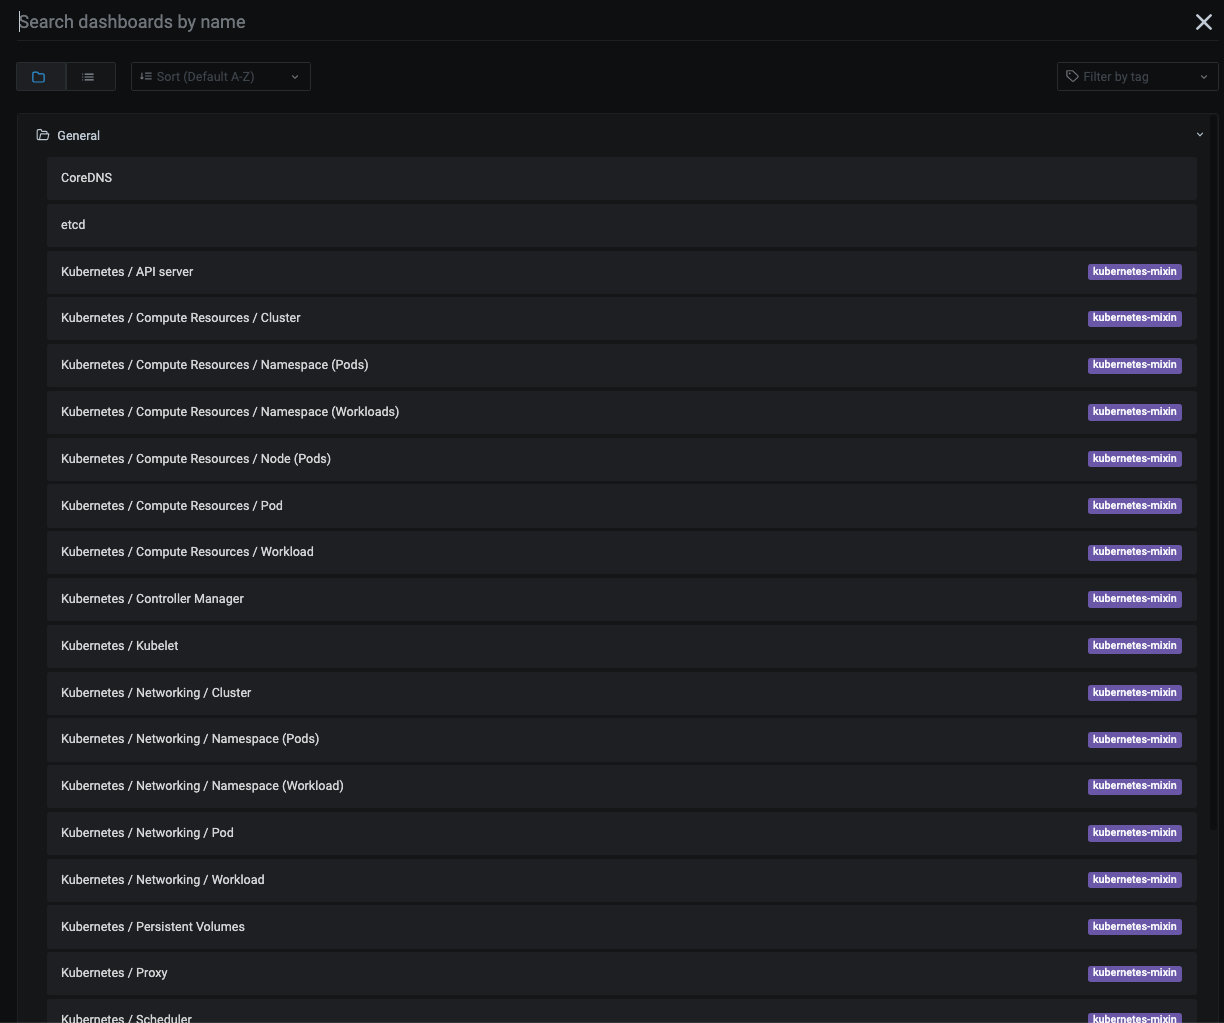
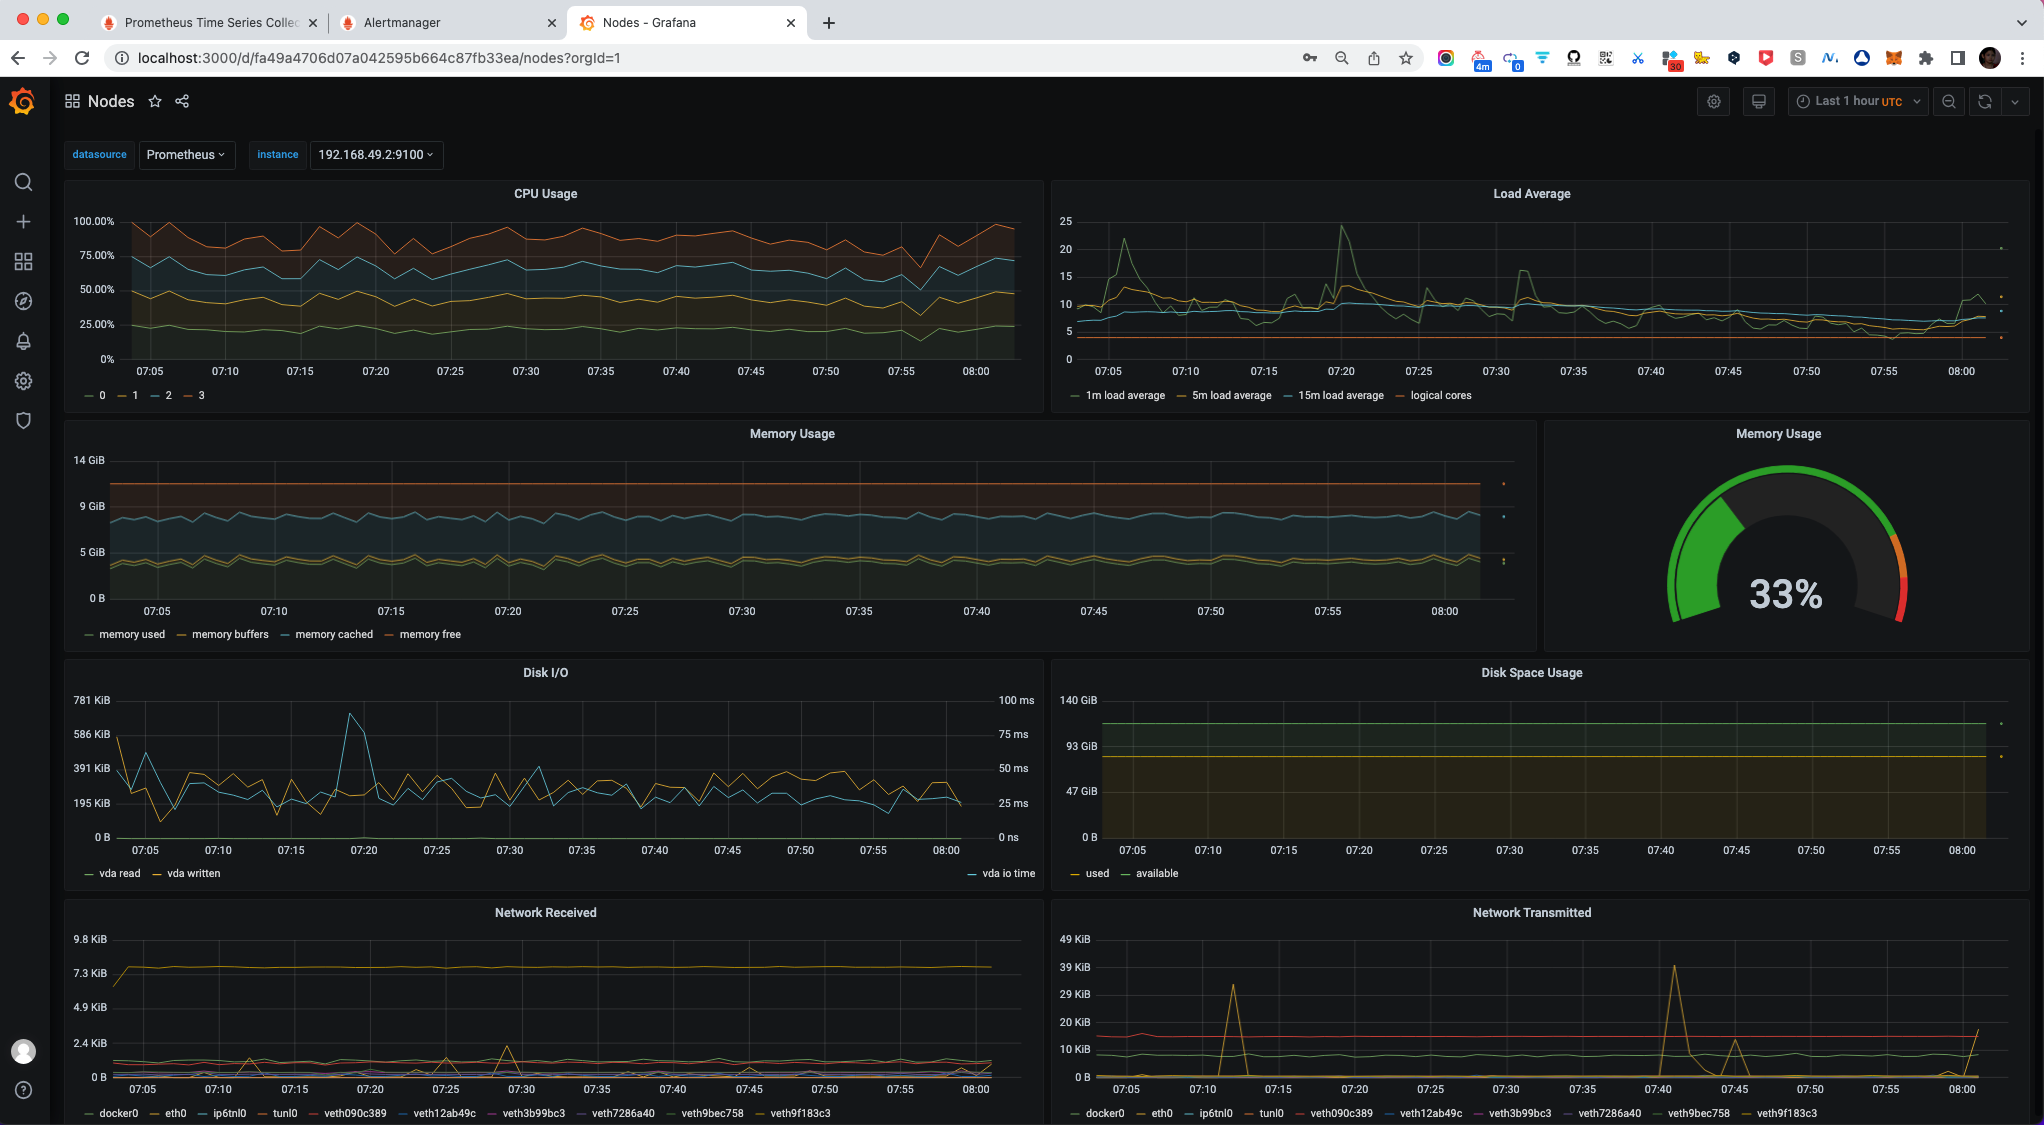
Nodes节点监控
在上图搜索框输入"node"
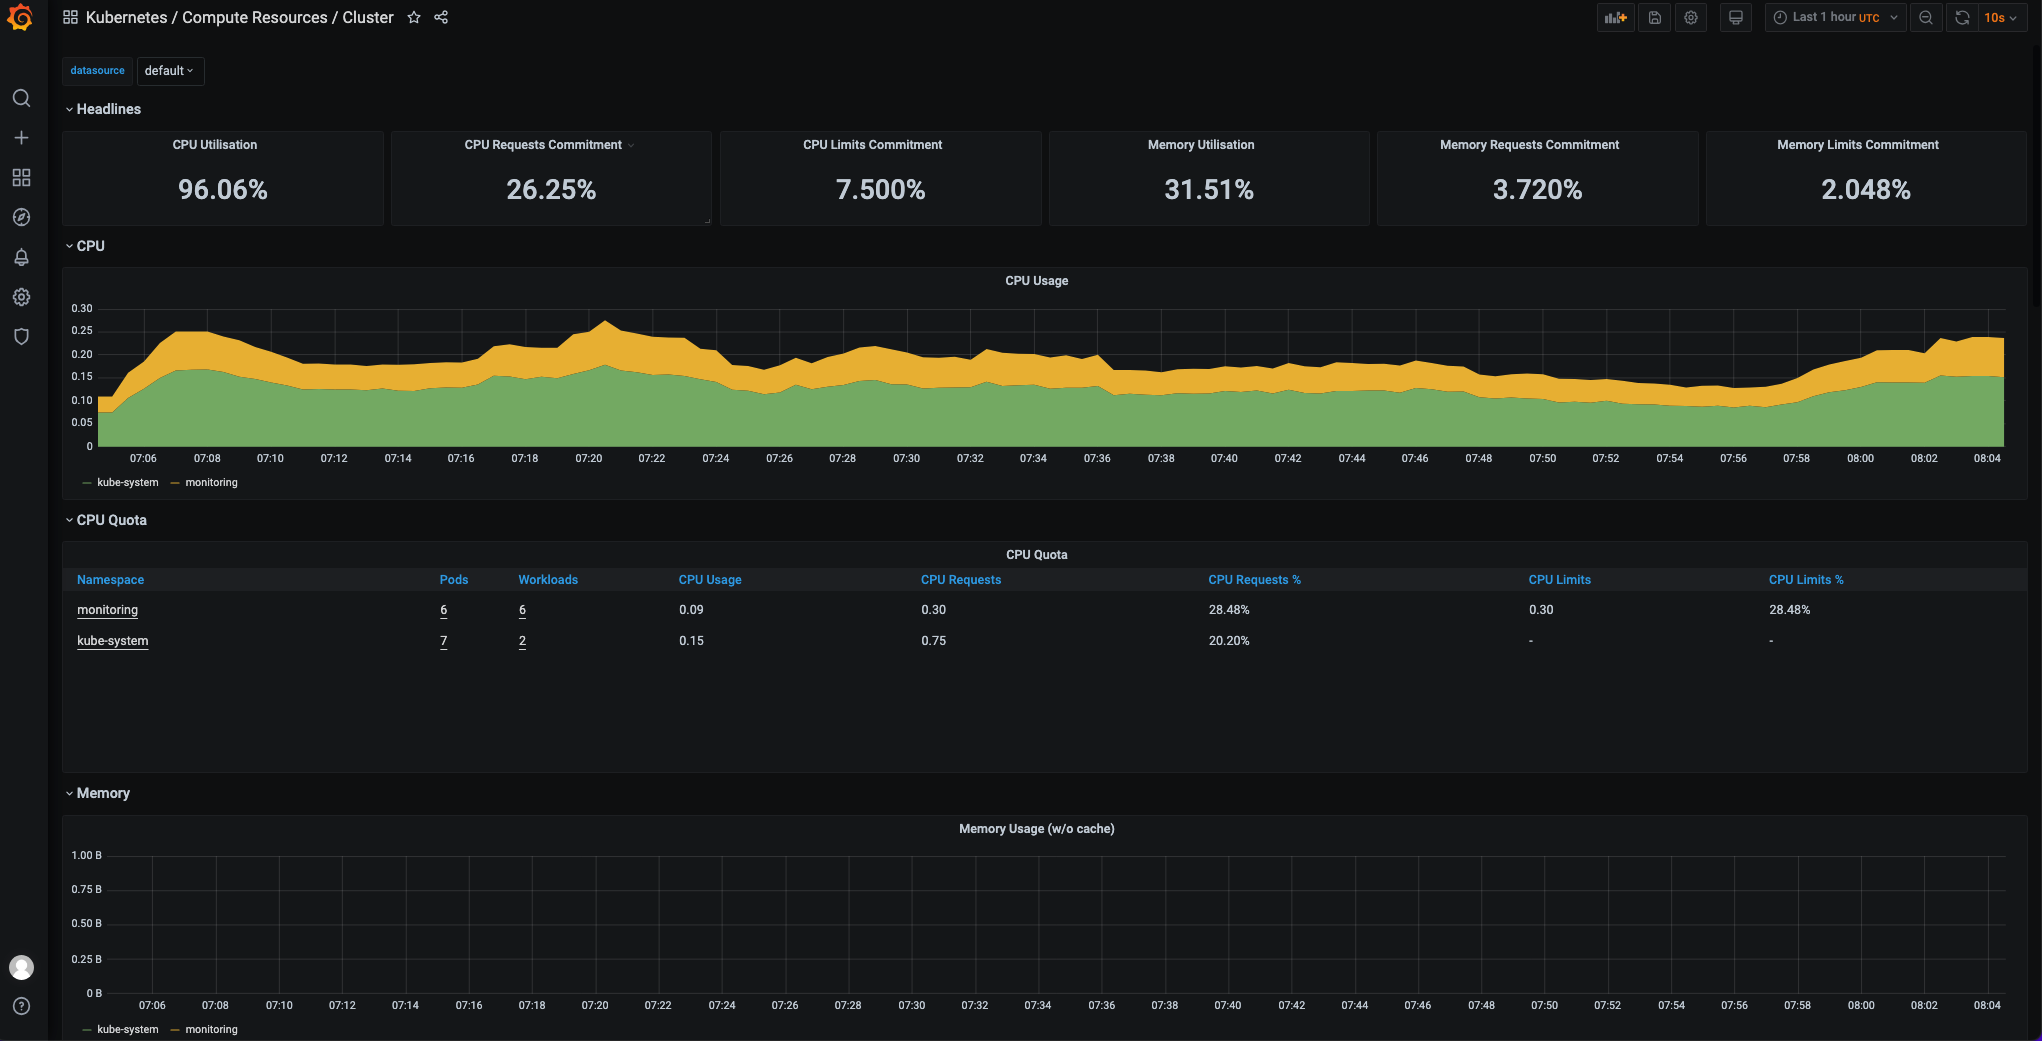
K8s/Compute Resources/Cluster监控

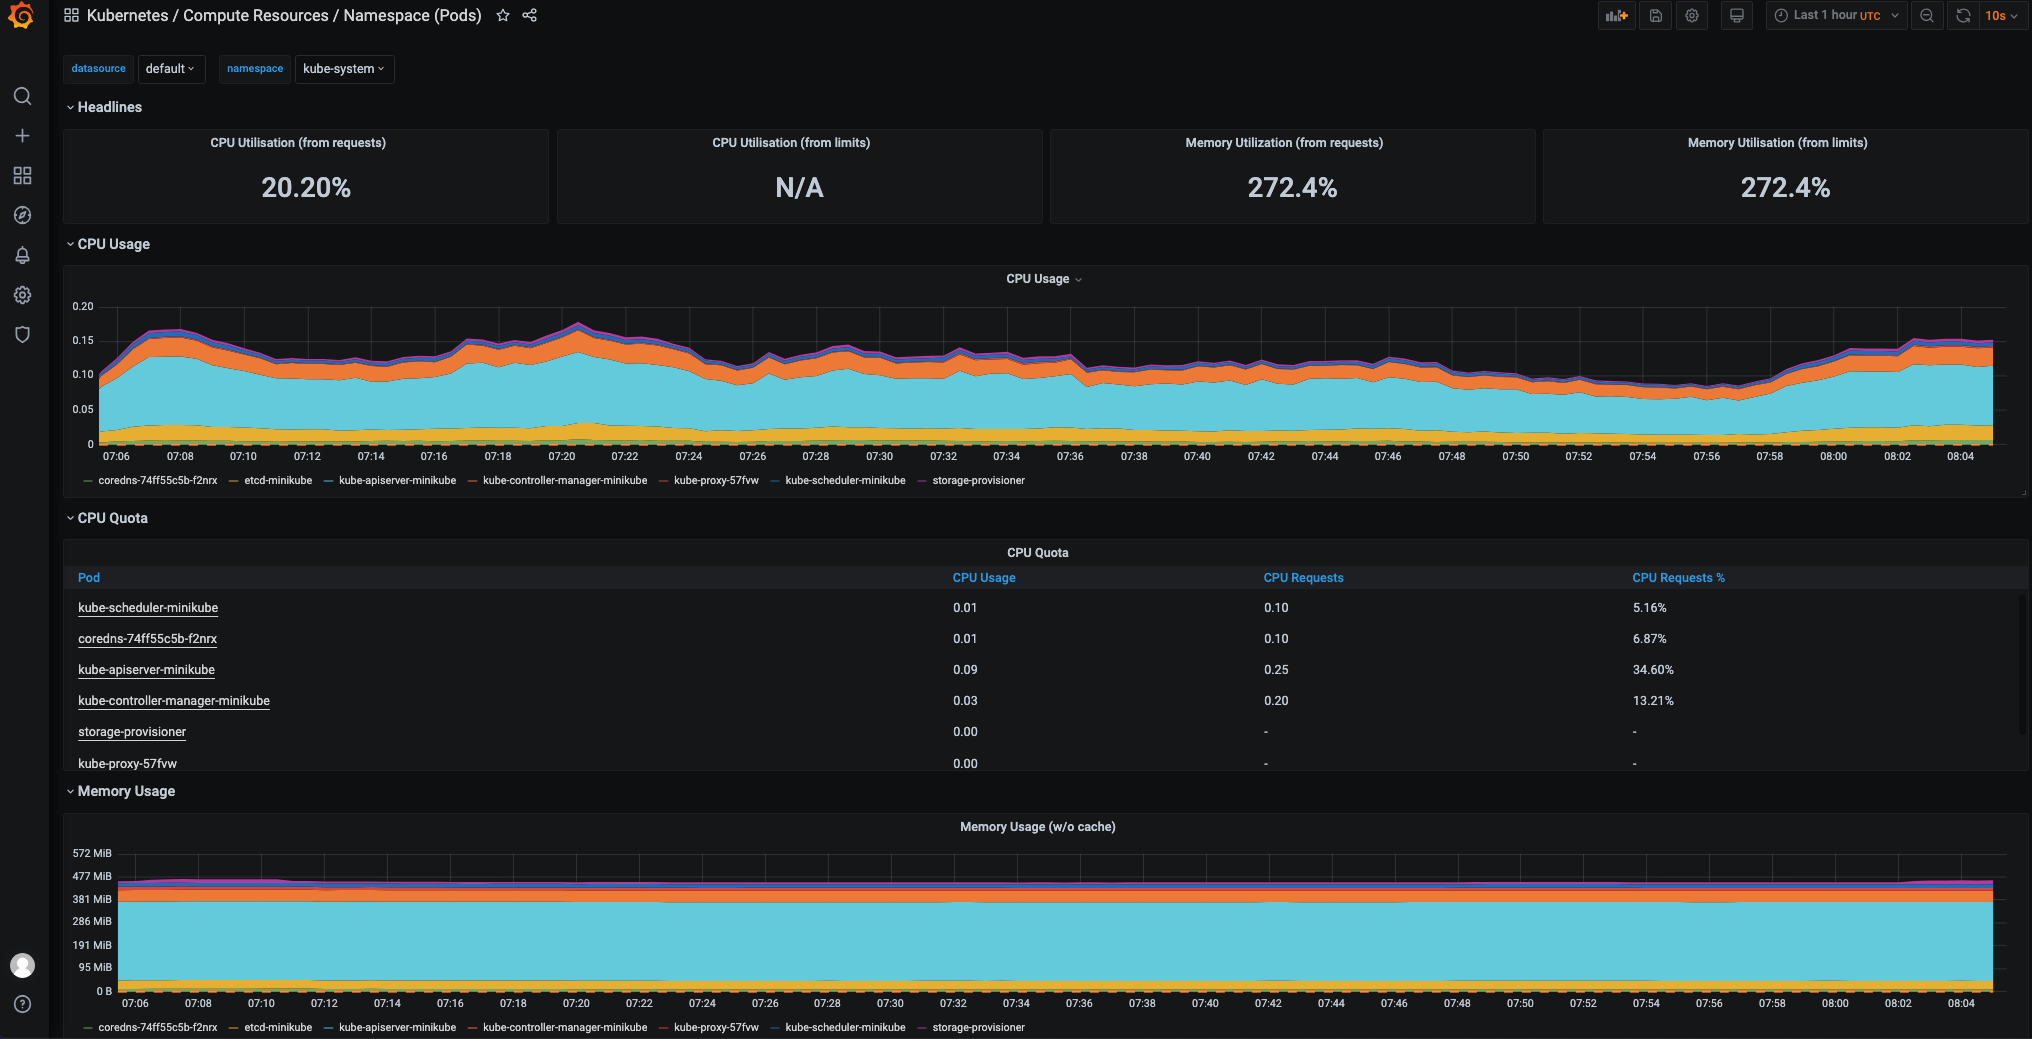
K8s/Compute Resources/Pod监控
定制Alertmanager邮件通知
安装FakeSMTP
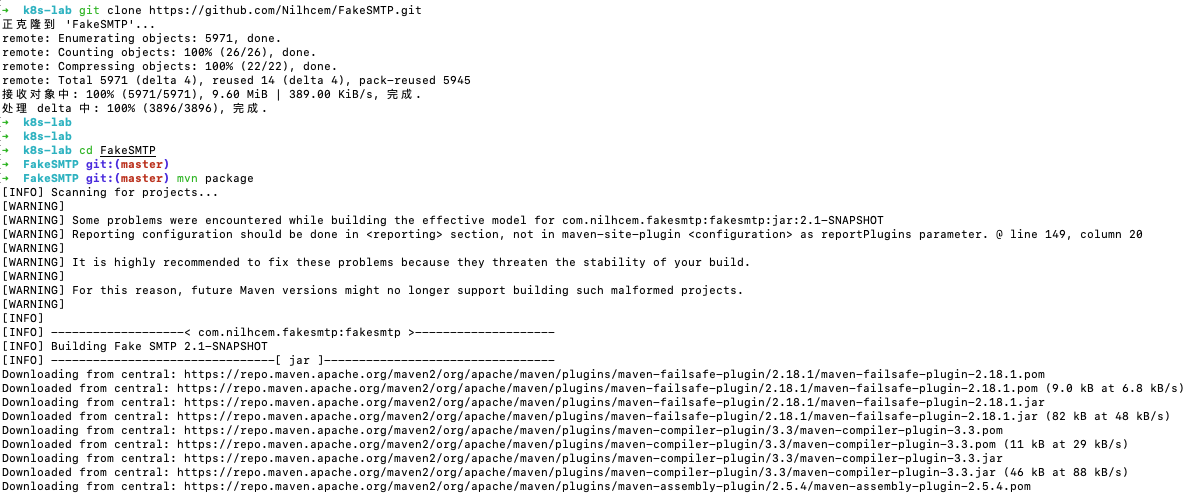
git clone https://github.com/Nilhcem/FakeSMTP.git
cd FakeSMTP
mvn package
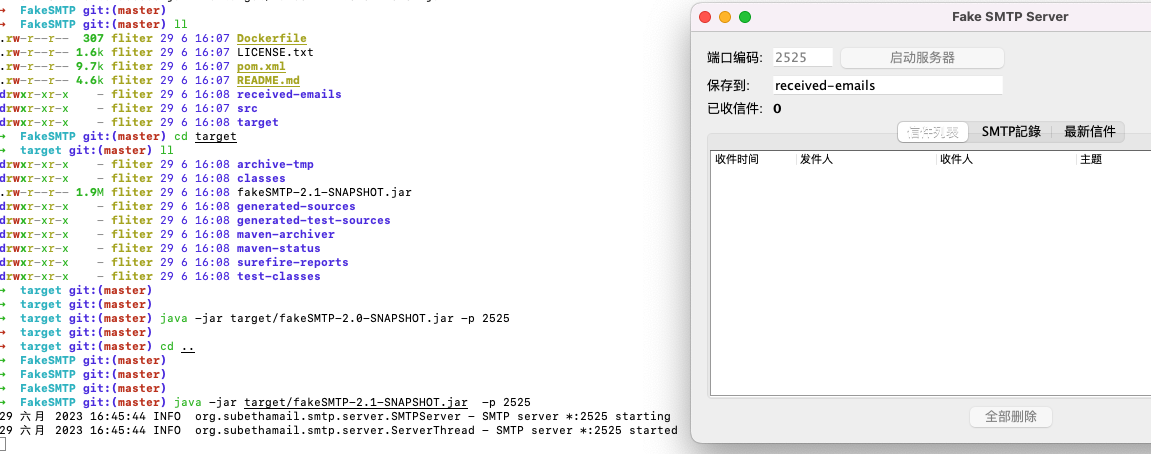
java -jar target/fakeSMTP-2.0-SNAPSHOT.jar -p 2525
现在需要改为 java -jar target/fakeSMTP-2.1-SNAPSHOT.jar -p 2525
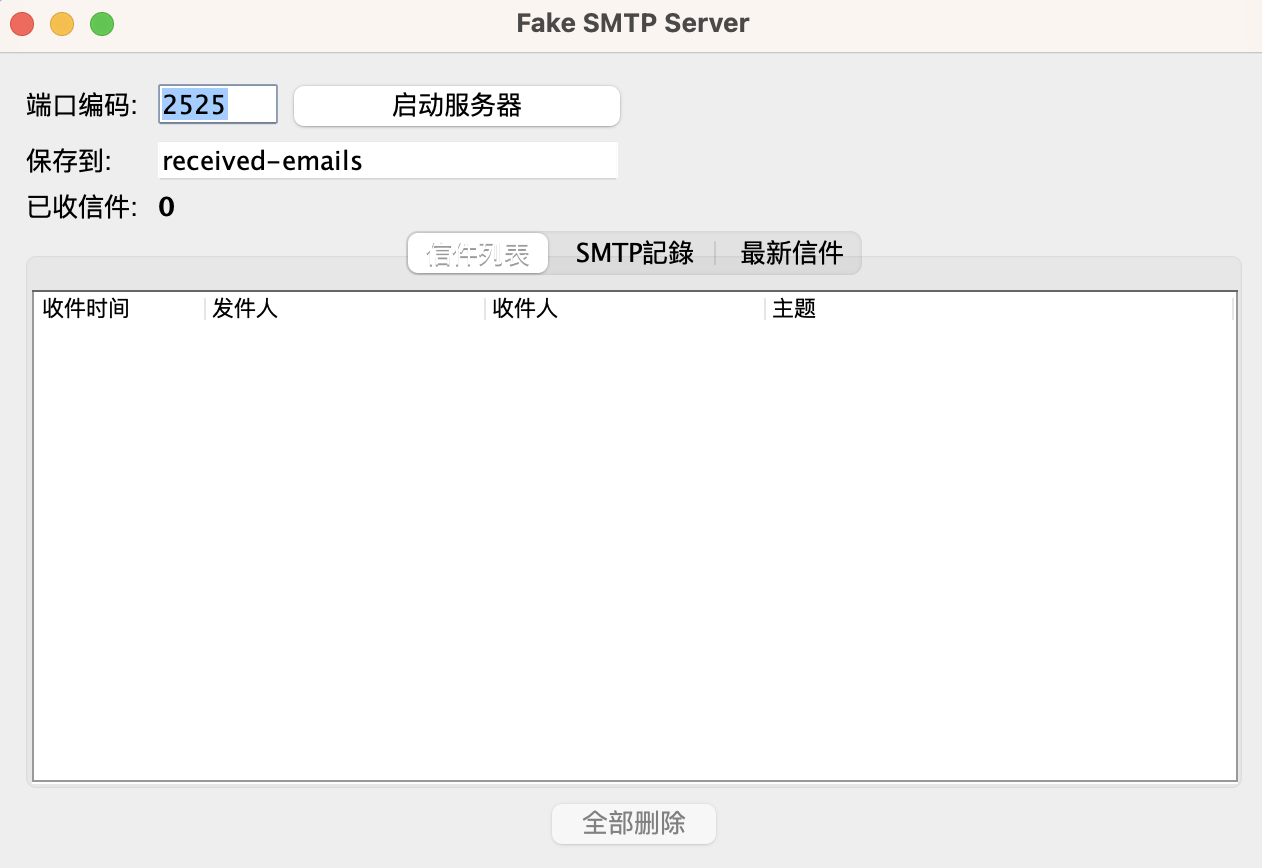
点击 启动服务器
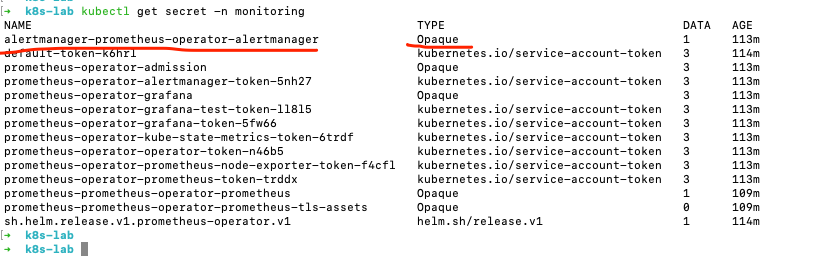
Alertmanager缺省配置(Secret)
kubectl get secret -n monitoring alertmanager-prometheus-operator-alertmanager -o go-template='左括号 左括号 index .data "alertmanager.yaml" 右括号 右括号' | base64 --decode (把汉字替换为对应符号,不这样hexo会解析出错)
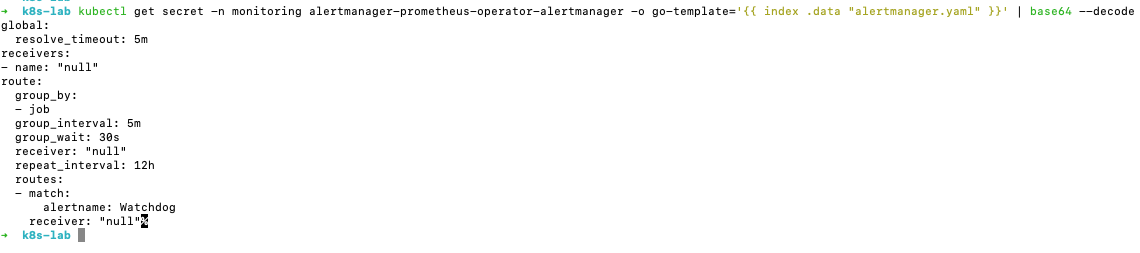
该命令用于从 Kubernetes 集群中的指定命名空间(-n monitoring)获取名为 alertmanager-prometheus-operator-alertmanager 的 Secret 对象,并提取其中名为 alertmanager.yaml 的数据字段的值。然后使用 base64 命令对该值进行解码,以便将其转换回原始的 YAML 格式。
换句话说,这个命令的目的是获取监控系统中 Alertmanager 的配置文件,并将其解码为可读的 YAML 格式,以便查看其中的配置详细信息。
因为这个配置是secret形式存储的
Opaque类型,所以最后要用 base64 --decode 转为明文
其实可以通过下面的UI直观查看
Alertmanager缺省配置(UI)
Alertmanager config更新
参考 https://github.com/helm/charts/blob/master/stable/prometheus-operator/values.yaml#L133
-
增加 邮件smtp等配置 -
增加静默配置(发送给null) -
增加抑制配置(inhibit)
Prometheus监控系统中,"静默配置"(inhibit configuration)用于在发生警报时控制通知的行为。通过静默配置,可以防止某些特定警报触发通知,以避免不必要的干扰或重复的通知。
静默配置定义了在特定条件下阻止警报通知的规则。这些规则通常基于警报标签和标签值的匹配。当触发一个警报时,系统将根据静默配置中的规则检查是否有匹配的规则存在。如果有匹配的规则,那么该警报将被静默,即不会触发通知。
通过使用静默配置,可以灵活地控制在某些情况下抑制警报通知,例如:
-
阻止在维护窗口期间触发通知。 -
抑制由特定部署环境引起的虚假警报。 -
防止多个相关的警报同时触发大量通知。
在Prometheus中,静默配置可以通过修改Alertmanager的配置文件(alertmanager.yaml)来实现,具体的配置语法和规则定义可以参考Prometheus的官方文档。
在Prometheus中,将通知发送给null属于静默配置的一种。当将静默规则配置为将通知发送给null时,实际上是将该警报完全静默化,意味着不会有任何通知发送。
这种配置适用于那些不希望触发任何通知的警报。通常,这可能是对特定类型的警报或某些特定条件下的警报进行静默化的一种方式。通过将通知发送给null,可以确保该警报不会引起任何干扰或通知负担。
静默规则配置示例:
inhibit_rules:
  - source_match:
      severity: critical
    target_match:
      severity: warning
    equal: ['alertname', 'service']
    target_receivers:
      - 'null'
上述示例中的静默规则指定了在警报的严重性为critical,并且警报名称和服务名称相同时,将通知发送给null,即静默该警报。
更新后的配置在 https://github.com/spring2go/k8s-msa-in-action/blob/master/ch08/07/values_alertmanager.yml
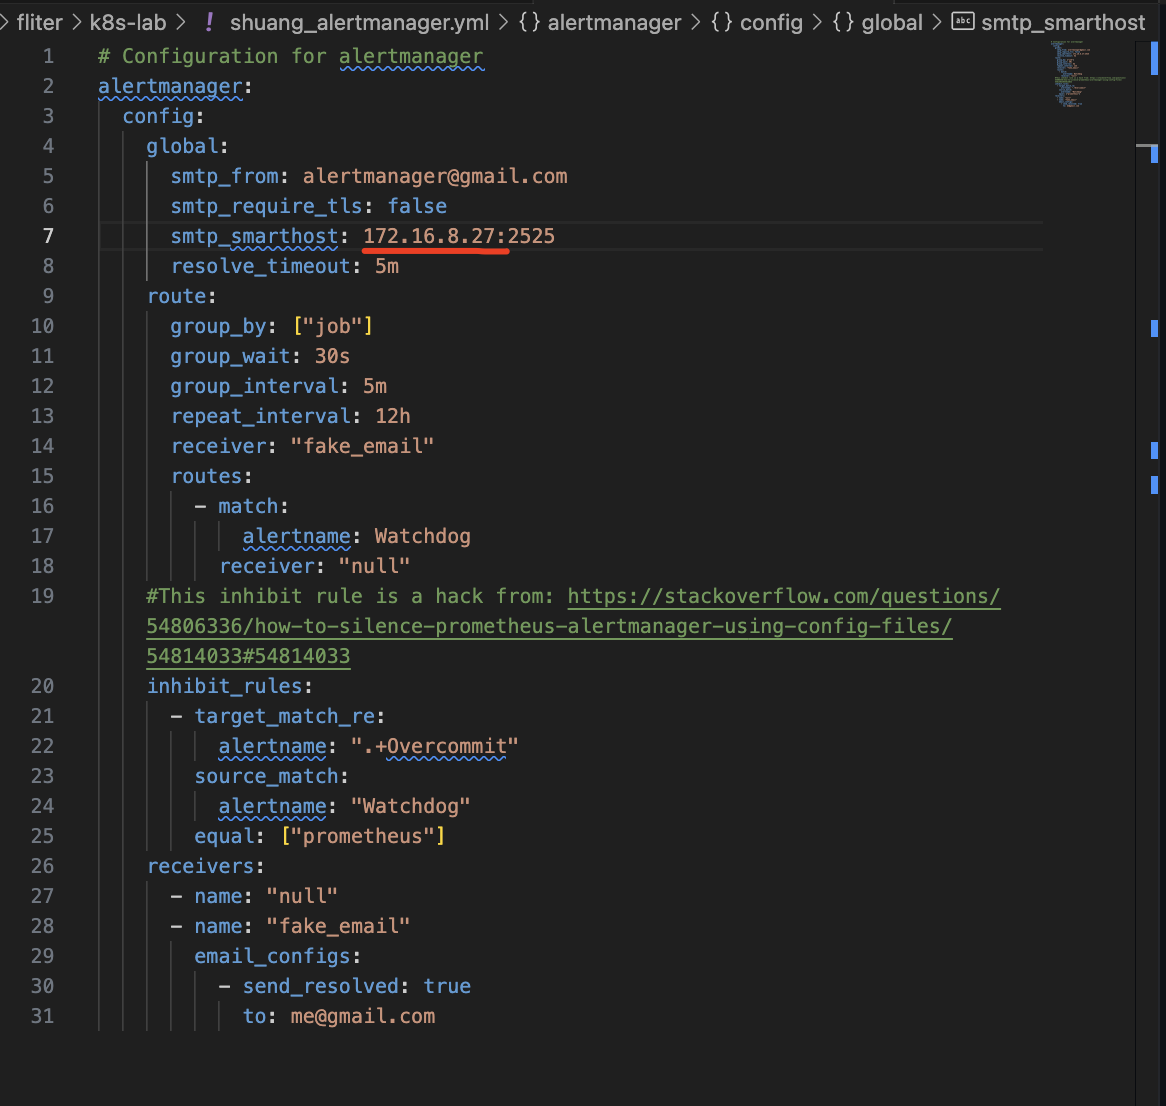
修改ip为本机地址
更新prometheus-operator release
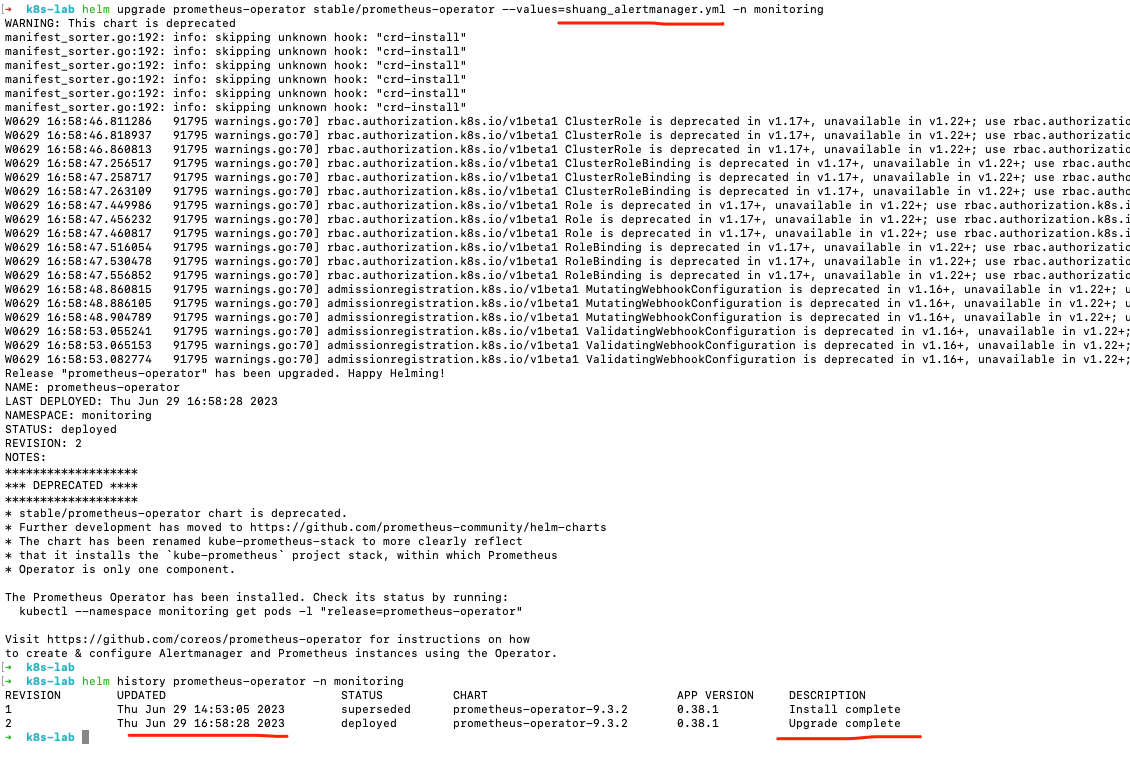
helm upgrade prometheus-operator stable/prometheus-operator --values=shuang_alertmanager.yml -n monitoring
helm history prometheus-operator -n monitoring
如果有问题,可以看pod日志进行排查~
kubectl logs -n monitoring alertmanager-prometheus-operator-alertmanager-0
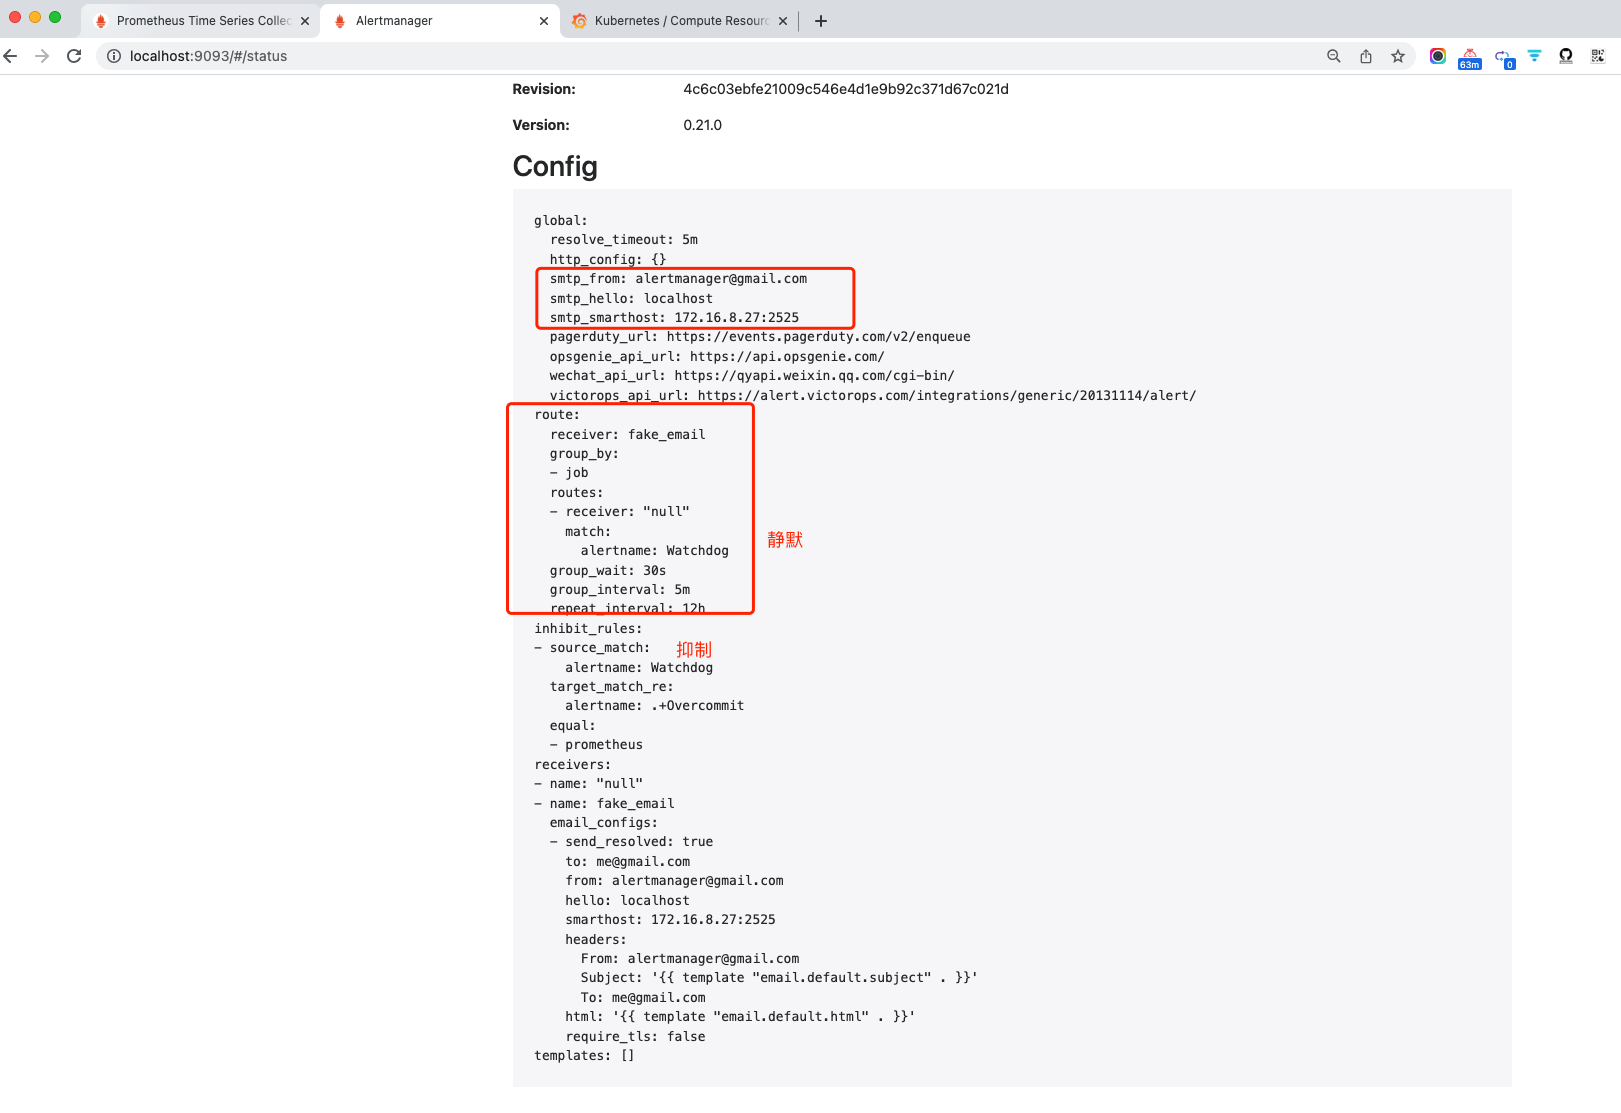
校验配置更新成功
打开 http://localhost:9093/#/status, 通过UI校验看是否修改成功~
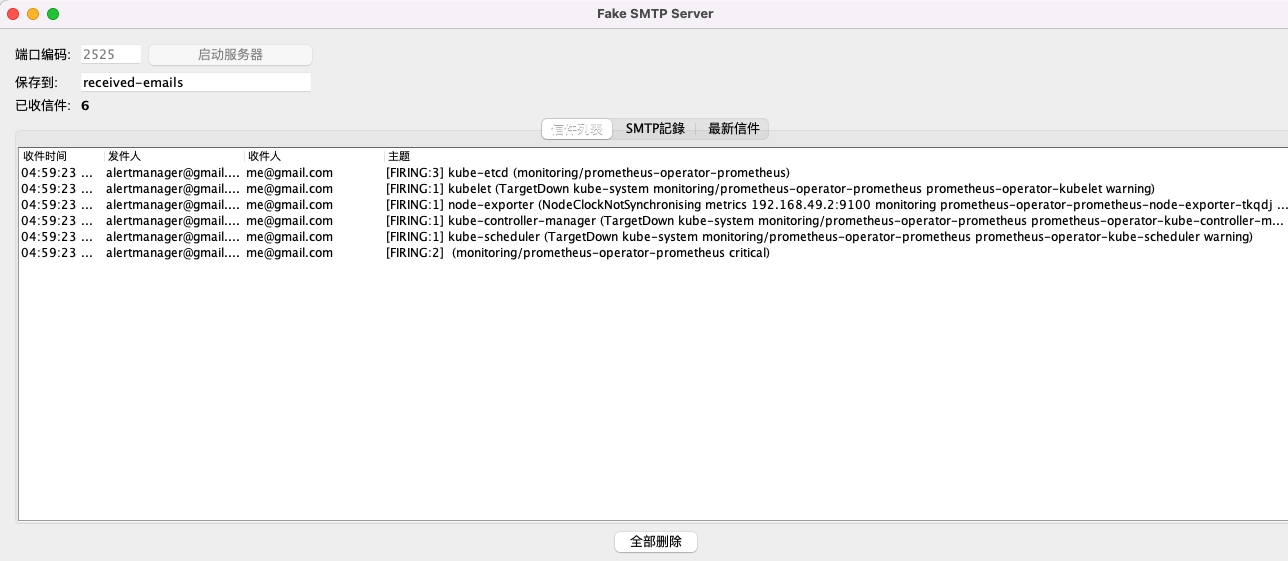
启动FakeSMTP接收告警
此时已经收到了邮件
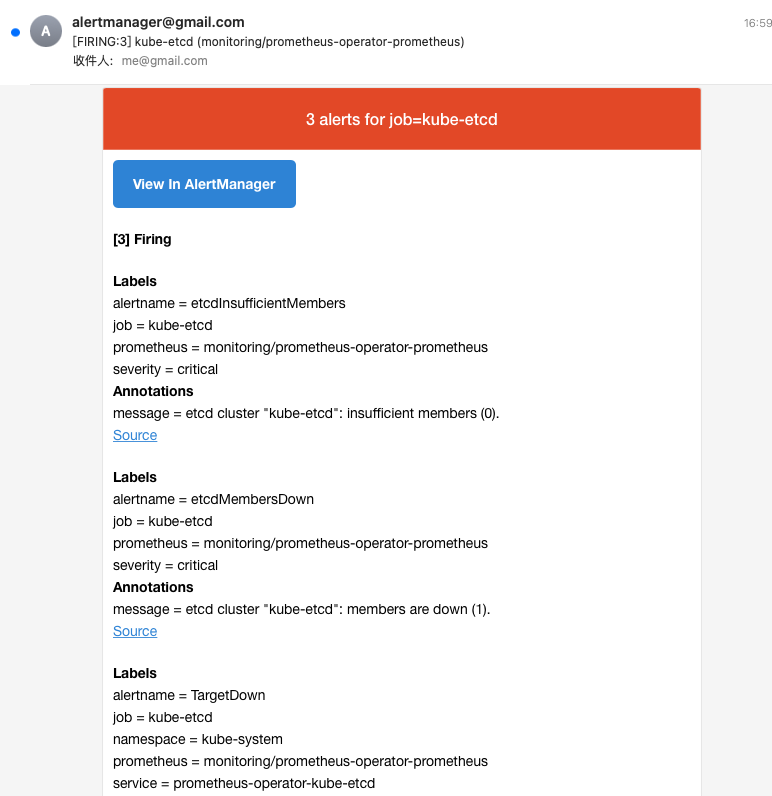
其中 etcd这项告警 message = etcd cluster "kube-etcd": members are down (1).是因为用minikube,etcd节点本来就不足~
.+Overcommit本来应该要收到告警,但通过配置抑制掉了
参考自
Kubernetes和微服务监控体系[4]
Kubernetes和微服务监控体系[5]
更多参考:
从零用Helm部署prometheus,并配置钉钉告警[6]
helm 安装配置 prom-operator[7]
参考资料
prometheus入门: https://dashen.tech/2020/09/14/prometheus%E5%85%A5%E9%97%A8/
[2]Kubernetes和微服务监控体系: https://blog.csdn.net/weixin_35821291/article/details/122877311
[3]issue: https://github.com/prometheus/prometheus/issues/1022
[4]Kubernetes和微服务监控体系: https://www.bilibili.com/video/BV1Qi4y1b79r/?p=8
[5]Kubernetes和微服务监控体系: https://blog.csdn.net/weixin_35821291/article/details/122877311
[6]从零用Helm部署prometheus,并配置钉钉告警: https://blog.csdn.net/lingjinghe/article/details/127646375
[7]helm 安装配置 prom-operator: https://blog.csdn.net/zhangxueleishamo/article/details/130339221
本文由 mdnice 多平台发布