引言
数据可视化是数据分析中的关键一环,它帮助我们理解数据模式、趋势和异常。在Python中,Matplotlib和Seaborn是两个流行的数据可视化库,它们提供了丰富的图表和图形选项,使数据的可视化变得简单而强大。
Matplotlib:Python的绘图库
Matplotlib是一个2D绘图库,它能够生成高质量的图形,并支持多种输出格式。它常被用作构建更高级可视化工具的基础。
功能
- 创建线图、散点图、柱状图等多种类型的图表。
- 定制图表的每个细节,包括标题、图例、坐标轴标签等。
使用方法
安装Matplotlib:
pip install matplotlib
创建一个简单的线图:
import matplotlib.pyplot as plt
import numpy as npfig = plt.figure()
x = np.arange(10)
y = 2.5 * np.sin(x / 20 * np.pi)
yerr = np.linspace(0.05, 0.2, 10)plt.errorbar(x, y + 3, yerr=yerr, label='both limits (default)')plt.errorbar(x, y + 2, yerr=yerr, uplims=True, label='uplims=True')plt.errorbar(x, y + 1, yerr=yerr, uplims=True, lolims=True,label='uplims=True, lolims=True')upperlimits = [True, False] * 5
lowerlimits = [False, True] * 5
plt.errorbar(x, y, yerr=yerr, uplims=upperlimits, lolims=lowerlimits,label='subsets of uplims and lolims')plt.legend(loc='lower right')

Seaborn:基于Matplotlib的数据可视化库
Seaborn是基于Matplotlib的高级可视化库,它提供了一系列丰富的图表类型,使得数据可视化更加直观和美观。
功能
- 提供了多种图表类型,如热力图、小提琴图、联合图等。
- 内置了对颜色管理的支持,使得图表颜色更加美观。
使用方法
安装Seaborn:
pip install seaborn
创建一个热力图:
import seaborn as sns
sns.set_theme()# Load the penguins dataset
penguins = sns.load_dataset("penguins")# Plot sepal width as a function of sepal_length across days
g = sns.lmplot(data=penguins,x="bill_length_mm", y="bill_depth_mm", hue="species",height=5
)# Use more informative axis labels than are provided by default
g.set_axis_labels("Snoot length (mm)", "Snoot depth (mm)")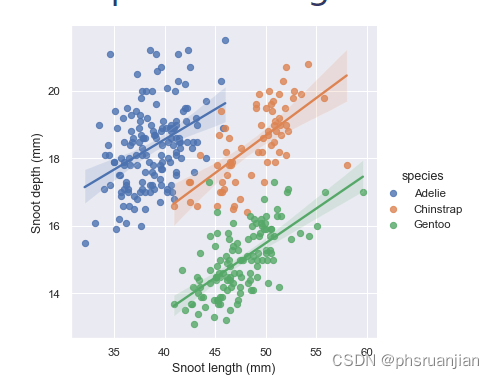
使用场景和具体代码
场景1:股票价格时间序列分析
Matplotlib可以用来绘制股票价格随时间变化的图表。
# 假设df是一个Pandas DataFrame,包含股票价格和日期
df['Date'] = pd.to_datetime(df['Date'])
df.set_index('Date', inplace=True)# 绘制股票价格
plt.figure(figsize=(10, 5))
plt.plot(df['Close'])
plt.title('Stock Price Over Time')
plt.xlabel('Date')
plt.ylabel('Price')
plt.show()
场景2:教育水平与收入关系
Seaborn可以用来展示教育水平与个人收入之间的关系。
# 假设df是一个Pandas DataFrame,包含教育水平和收入的数据
sns.lineplot(data=df, x='Education Level', y='Income', hue='Gender')# 显示图表
plt.show()
场景3:全球平均温度变化
Seaborn的小提琴图可以展示全球平均温度随时间的变化。
# 假设df是一个Pandas DataFrame,包含年份和平均温度的数据
sns.violinplot(x='Year', y='Temperature', data=df)# 显示图表
plt.show()
结语
Matplotlib和Seaborn是数据可视化的强大工具,它们可以帮助我们更直观地理解数据,并揭示数据背后的故事。通过结合使用这两个库,我们可以创建从简单到复杂的各种图表,以适应不同的数据分析需求。
作者注:
本博客提供了Matplotlib和Seaborn在数据可视化中的基本应用示例。在实际应用中,根据数据的特点和可视化的需求,可能需要对上述代码进行适当的调整。
注意:在实际应用中,确保安装了所需的库,并且数据文件的路径正确。如果需要查看图表的可视化效果,可以使用在线的Python环境,如Google Colab,它允许你运行代码并查看结果。
