Opentelemetry collector用法
- Opentelemetry collector用法
- Service
- Extensions
- healthcheckextension
- Pipelines
- receiver
- OTLP Receiver
- prometheus receiver
- filelog receiver
- Processor
- 数据归属
- Important
- memory limiter processor
- batch processor
- attributes processor && Resource Processor
- filter processor
- k8s attributes processor
- Tail Sampling Processor
- transform processor
- routing processor
- Exporter
- debug exporter
- otlp exporter
- otlp http exporter
- prometheus exporter
- prometheus remote write exporter
- loadbalancing exporter
- Connector
- roundrobin connector
- span metrics connector
- troubleshooting
- 扩容
- 何时扩容
- 如何扩容
- stateful
- Service
Opentelemetry collector包含如下几个组件:
- receiver
- processor
- exporter
- connector
- Service
注意这里只是定义了各个组件,若要真正生效,则需要将其添加到service中.
官方的opentelemetry-collector和opentelemetry-collector-contrib两个库给出了大量Collector组件实现。前者是opentelemetry-collector的核心配置,用于提供vendor无关的collector配置,后者则由不同的vendor提供,如aws、aure、kafka等。在使用时可以通过结合二者功能来满足业务需求。另外值得注意的是,两个仓库的各个组件目录中都提供了README.md帮助文档,如otlpreceiver、prometheusremotewriteexporter等。
Service
service字段用于组织启用receivers, processors, exporters和 extensions 组件。一个service包含如下子字段:
- Extensions
- Pipelines
- Telemetry:支持配置metric和log。
-
默认情况下,opentelemetry会在
http://127.0.0.1:8888/metrics下暴露metrics,可以通过telemetry.metrics.address指定暴露metrics的地址。可以使用level字段控制暴露的metrics数(这里给出了各个level下的metrics):none: 不采集遥测数据basic: 采集基本的遥测数据normal: 默认级别,在basic之上增加标准的遥测数据detailed: 最详细的级别,包括dimensions 和 views.
-
log的默认级别为
INFO,支持DEBUG、WARN、ERROR。
-
Extensions
可以使用extensions实现Collector的认证、健康监控、服务发现或数据转发等。大部分extensions都有默认配置。
service:extensions: [health_check, pprof, zpages]telemetry:metrics:address: 0.0.0.0:8888level: normal
healthcheckextension
可以为pod的probe提供健康检查:
extensions:health_check:endpoint: ${env:MY_POD_IP}:13133
Pipelines
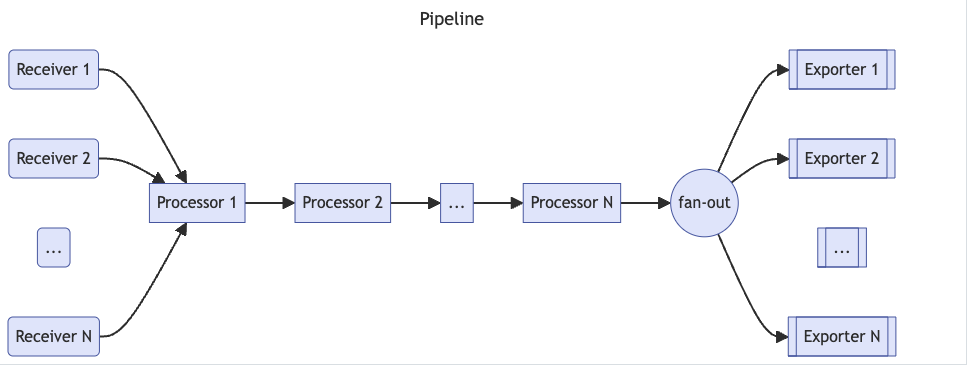
一个pipeline包含receivers、processors和exporters集,相同的receivers、processors和exporters可以放到多个pipeline中。
配置pipeline,类型为:
traces: 采集和处理trace数据metrics:采集和处理metric数据logs:采集和处理log数据
注意processors的位置顺序决定了其处理顺序。
service:pipelines:metrics:receivers: [opencensus, prometheus]processors: [batch]exporters: [opencensus, prometheus]traces:receivers: [opencensus, jaeger]processors: [batch, memory_limiter]exporters: [opencensus, zipkin]
下面主要介绍几种常见的组件配置。
receiver
用于接收遥测数据。
可以通过<receiver type>/<name>为一类receiver配置多个receivers,确保receiver的名称唯一性。collector中至少需要配置一个receiver。
receivers:# Receiver 1.# <receiver type>:examplereceiver:# <setting one>: <value one>endpoint: 1.2.3.4:8080# ...# Receiver 2.# <receiver type>/<name>:examplereceiver/settings:# <setting two>: <value two>endpoint: 0.0.0.0:9211
OTLP Receiver
使用OTLP格式接收gRPC或HTTP流量,这种为push模式,即需要client将遥测数据push到opentelemetry:
receivers:otlp:protocols:grpc:http:
k8s下可以使用如下方式定义otlp receiver:
receivers:otlp:protocols:grpc:endpoint: ${env:MY_POD_IP}:4317 #定义接收grpc数据格式的serverhttp:endpoint: ${env:MY_POD_IP}:4318 #定义接收http数据格式的server
Receiver本身支持push和pull模式,如haproxyreceiver就是pull模式:
receivers:haproxy:endpoint: http://127.0.0.1:8080/statscollection_interval: 1mmetrics:haproxy.connection_rate:enabled: falsehaproxy.requests:enabled: true
prometheus receiver
prometheusreceiver支持使用prometheus 的方式pull metrics数据,但需要注意的是,该方式目前处于开发阶段,官方给出了注意事项和不支持的特性:
receivers:prometheus:config:scrape_configs:- job_name: 'otel-collector'scrape_interval: 5sstatic_configs:- targets: ['0.0.0.0:8888']- job_name: k8skubernetes_sd_configs:- role: podrelabel_configs:- source_labels: [__meta_kubernetes_pod_annotation_prometheus_io_scrape]regex: "true"action: keepmetric_relabel_configs:- source_labels: [__name__]regex: "(request_duration_seconds.*|response_duration_seconds.*)"action: keep
filelog receiver
filelog-receiver用于从文件中采集日志。
Processor
根据各个processor定义的规则或配置来修改或转换receiver采集的数据,如过滤、丢弃、重命名等操作。Processors的执行顺序取决于service.pipelines中定义的Processors顺序。推荐的processors如下:
- memory_limiter
- sampling processors 或初始的filtering processors
- 依赖Context发送源的processor,如
k8sattributes - batch
- 其他processors
数据归属
由于一个receiver可能会附加到多个pipelines上,因此可能存在多个processors同时处理来自同一个receiver的数据,这里涉及到数据归属权的问题。从pipelines的角度看有两种数据归属模式:
- 独占数据:这种模式下,pipeline会复制从receiver接收到的数据,各个pipeline之间不会相互影响。
- 共享数据:这种模式下,pipeline不会复制从receiver接收到的数据,多个pipeline共享同一份数据,且数据是只读的,无法修改。可以通过设置
MutatesData=false来避免独占模式下的数据拷贝。
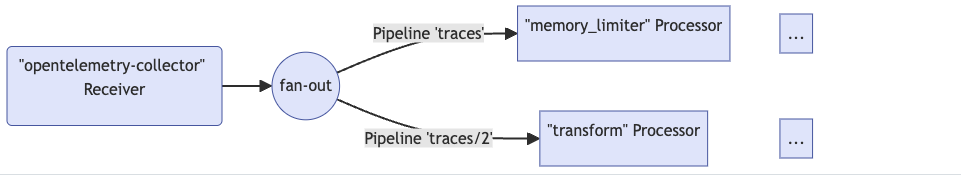
注意:在官方的文档中有如下警告,即当多个pipelines引用了同一个receiver时,只能保证各个pipeline的数据是独立的,但由于整个流程使用的是同步调用方式,因此如果一个pipeline阻塞,则会导致其他使用使用相同receiver的pipelines也被阻塞:
Important
When the same receiver is referenced in more than one pipeline, the Collector creates only one receiver instance at runtime that sends the data to a fan-out consumer. The fan-out consumer in turn sends the data to the first processor of each pipeline. The data propagation from receiver to the fan-out consumer and then to processors is completed using a synchronous function call. This means that if one processor blocks the call, the other pipelines attached to this receiver are blocked from receiving the same data, and the receiver itself stops processing and forwarding newly received data.
memory limiter processor
用于防止collector OOM。该processor会周期性地检查内存情况,如果使用的内存大于设置的阈值,则执行一次runtime.GC()。memorylimiterprocessor有两个阈值:soft limit和hard limit。当内存用量超过soft limit时,processor将拒绝接收数据并返回错误(因此要求能够重试发生数据,否则会有数据丢失),直到内存用量低于soft limit;如果内存用量超过hard limit,则会强制执行一次GC。
推荐将memorylimiterprocessor设置为第一个processor。设置参数如下:
check_interval(默认 0s): 内存检查周期,推荐值为1s。如果Collector内存有尖刺,则可以降低check_interval或增加spike_limit_mib,以避免内存超过hard limit。limit_mib(默认 0): 定义hard limit,进程堆申请的最大内存值,单位MiB。注意,通常总内存会高于该值约50MiB。spike_limit_mib(默认为20%的limit_mib): 测量内存使用之间预期的最大峰值,必须小于limit_mib.。soft limit 等于 (limit_mib-spike_limit_mib),spike_limit_mib的推荐值为20%limit_mib。limit_percentage(默认 0): 通过百分比来定义进程堆申请的最大内存,其优先级低于limit_mibspike_limit_percentage(默认 0): 通过百分比来测量内存使用之间预期的最大峰值,只能和limit_percentage配合使用。
使用方式如下:
processors:memory_limiter:check_interval: 1slimit_mib: 4000spike_limit_mib: 800
processors:memory_limiter:check_interval: 1slimit_percentage: 50spike_limit_percentage: 30
batch processor
batch processor可以接收spans, metrics,或logs,通过压缩数据来降低数据传输所需的连接。
推荐在每个Collector上都配置batch processor,并将其放到memory_limiter和sampling processors之后。有根据大小和间隔时间两种batch发送模式。
配置参数如下:
send_batch_size(默认 8192): 定义发送batch的(spans, metric data points或 log records的)数目,超过该数值后会发送一个batch。timeout(默认 200ms): 定义发送batch的超时时间,超过该时间会发送一个batch。如果设置为0,则会忽略send_batch_size并只根据send_batch_max_size来发送数据。send_batch_max_size(默认 0): batch的大小上限,必须大于或等于send_batch_size。0表示没有上限。metadata_keys(默认为空): 如果设置了该值,则processor会为每个不同组合的client.Metadata值创建一个batcher实例。注意使用元数据执行batch会增加batch所需要的内存。metadata_cardinality_limit(默认1000): 当metadata_keys非空,该值限制了需要处理的metadata key的组合数目。
下面定义了一个默认的batch processor和一个自定义的batch processor。注意这里只是声明,若要生效还需在service中引用。
processors:batch:batch/2:send_batch_size: 10000timeout: 10s
attributes processor && Resource Processor
Resource Processor可以看作是attributes processor的子集,用于修改资源( span、log、metric)属性。
attributes processor有两个主要功能:修改资源属性,以及数据过滤。通常用于修改资源属性,数据过滤可以考虑使用filterprocessor。
下面是常见的修改资源属性的方式,类似prometheus修改label。更多参见官方例子:
processors:attributes/example:actions:- key: db.tableaction: delete- key: redacted_spanvalue: trueaction: upsert- key: copy_keyfrom_attribute: key_originalaction: update- key: account_idvalue: 2245action: insert- key: account_passwordaction: delete- key: account_emailaction: hash- key: http.status_codeaction: convertconverted_type: int
filter processor
用于丢弃Collector采集的spans、span events、metrics、datapoints和logs。filterprocessor会使用OTTL语法来创建是否需要丢弃遥测数据的conditions,如果匹配任意condition,则丢弃。
traces.span |
Span |
|---|---|
traces.spanevent |
SpanEvent |
metrics.metric |
Metric |
metrics.datapoint |
DataPoint |
logs.log_record |
Log |
如下面丢弃所有HTTP spans:
processors:filter:error_mode: ignoretraces:span:- attributes["http.request.method"] == nil
此外filter processor还支持OTTL Converter functions。如
# Drops metrics containing the 'bad.metric' attribute key
filter/keep_good_metrics:error_mode: ignoremetrics:metric:- 'HasAttrKeyOnDatapoint("bad.metric")'
k8s attributes processor
该processor可以自动发现k8s资源,然后将所需的metadata信息注入span、metrics和log中,作为resources属性。
k8sattributesprocessor在接收到数据(log, trace or metric)时,会尝试将数据和pod进行匹配,如果匹配成功,则将相关的pod metadata注入该数据。默认情况下,k8sattributesprocessor使用入站的连接IP 和Pod IP进行关联,但也可以通过resource_attribute自定义关联方式:
每条规则包含一对from(表示规则类型)和name(如果from为resource_attribute,则表示属性名称)。
from有两种类型:
connection:使用连接上下午中的IP属性匹配数据。使用此类型时,该processor必须位于任何batching或tail sampling之前。resource_attribute:从接收的资源中指定用于匹配数据的属性。只能使用metadata的属性。
pod_association:# below association takes a look at the datapoint's k8s.pod.ip resource attribute and tries to match it with# the pod having the same attribute.- sources:- from: resource_attributename: k8s.pod.ip# below association matches for pair `k8s.pod.name` and `k8s.namespace.name`- sources:- from: resource_attributename: k8s.pod.name- from: resource_attributename: k8s.namespace.name
默认情况下会提取并添加如下属性,可以通过metadata修改默认值:
k8s.namespace.namek8s.pod.namek8s.pod.uidk8s.pod.start_timek8s.deployment.namek8s.node.name
k8sattributesprocessor支持从pods、namespaces和nodes的labels和annotations上提取(extract)资源属性。
extract:annotations:- tag_name: a1 # extracts value of annotation from pods with key `annotation-one` and inserts it as a tag with key `a1`key: annotation-onefrom: pod- tag_name: a2 # extracts value of annotation from namespaces with key `annotation-two` with regexp and inserts it as a tag with key `a2`key: annotation-tworegex: field=(?P<value>.+)from: namespace- tag_name: a3 # extracts value of annotation from nodes with key `annotation-three` with regexp and inserts it as a tag with key `a3`key: annotation-threeregex: field=(?P<value>.+)from: nodelabels:- tag_name: l1 # extracts value of label from namespaces with key `label1` and inserts it as a tag with key `l1`key: label1from: namespace- tag_name: l2 # extracts value of label from pods with key `label2` with regexp and inserts it as a tag with key `l2`key: label2regex: field=(?P<value>.+)from: pod- tag_name: l3 # extracts value of label from nodes with key `label3` and inserts it as a tag with key `l3`key: label3from: node
完整例子如下,由于k8sattributesprocessor本身也是一个k8s Controller,因此需要通过filter指定listwatch的范围:
k8sattributes:
k8sattributes/2:auth_type: "serviceAccount"passthrough: falsefilter:node_from_env_var: KUBE_NODE_NAMEextract:metadata:- k8s.pod.name- k8s.pod.uid- k8s.deployment.name- k8s.namespace.name- k8s.node.name- k8s.pod.start_timelabels:- tag_name: app.label.componentkey: app.kubernetes.io/componentfrom: podpod_association:- sources:- from: resource_attributename: k8s.pod.ip- sources:- from: resource_attributename: k8s.pod.uid- sources:- from: connection
Tail Sampling Processor
基于预定义的策略来采样traces。注意,为了有效执行采样策略,必须在相同的Collector实例中处理一个trace下的所有spans。必须将该processor放到依赖context的processors(如k8sattributes)之后,否则重组会导致丢失原始的context。在执行采样之前,会根据trace_id对spans进行分组,因此无需groupbytraceprocessor就可以直接使用tail sampling processor。
tailsamplingprocessor中and是一个比较特别的策略,它会使用AND逻辑串联多条策略。例如下面例子中的and串联了多条策略,用于:
- 过滤出
service.name为[service-1, service-2, service-3]的数据 - 然后从上述3个服务的数据中过滤出
http.route为[/live, /ready]的数据 - 最后将来自
[service-1, service-2, service-3]服务的[/live, /ready]的数据的采样率设置为0.1
and:{and_sub_policy: # and逻辑的策略集[{# filter by service namename: service-name-policy,type: string_attribute,string_attribute:{key: service.name,values: [service-1, service-2, service-3],},},{# filter by routename: route-live-ready-policy,type: string_attribute,string_attribute:{key: http.route,values: [/live, /ready],enabled_regex_matching: true, #启用正则表达式},},{# apply probabilistic samplingname: probabilistic-policy,type: probabilistic,probabilistic: { sampling_percentage: 0.1 },},],},
更多参见官方例子
transform processor
该processor包含一系列与Context 类型相关的conditions和statements,并按照配置顺序,对接收的遥测数据执行conditions和statements。它使用了一种名为OpenTelemetry Transformation Language的类SQL语法。
transform processor可以trace、metrics和logs配置多个context statements,context指定了statements使用的OTTL Context:
| Telemetry | OTTL Context |
|---|---|
Resource |
Resource |
Instrumentation Scope |
Instrumentation Scope |
Span |
Span |
Span Event |
SpanEvent |
Metric |
Metric |
Datapoint |
DataPoint |
Log |
Log |
trace、metric和log支持的Context如下:
| Signal | Context Values |
|---|---|
| trace_statements | resource, scope, span, and spanevent |
| metric_statements | resource, scope, metric, and datapoint |
| log_statements | resource, scope, and log |
每个statement可以包含一个Where子语句来校验是否执行statement。
transform processor 还支持一个可选字段,error_mode,用于确定processor如何应对statement产生的错误。
| error_mode | description |
|---|---|
| ignore | processor忽略错误,记录日志,并继续执行下一个statement,推荐模式。 |
| silent | processor忽略错误,不记录日志,并继续执行下一个statement。 |
| propagate | processor向pipeline返回错误,导致Collector丢弃payload。默认选项。 |
此外transform processor还支持OTTL函数可以添加、删除、修改遥测数据。
如下面例子中,如果attribute test不存在,则将attribute test设置为pass:
transform:error_mode: ignoretrace_statements:- context: spanstatements:# accessing a map with a key that does not exist will return nil. - set(attributes["test"], "pass") where attributes["test"] == nil
debug
通过在Collector启用debug日志来进行定位:
receivers:filelog:start_at: beginninginclude: [ test.log ]processors:transform:error_mode: ignorelog_statements:- context: logstatements:- set(resource.attributes["test"], "pass")- set(instrumentation_scope.attributes["test"], ["pass"])- set(attributes["test"], true)exporters:debug:service:telemetry:logs:level: debugpipelines:logs:receivers:- filelogprocessors:- transformexporters:- debug
routing processor
将logs, metrics 或 traces路由到指定的exporter。此processor需要根据入站的HTTP请求(gRPC)首部或资源属性值来将trace信息路由到特定的exporters。
注意:
- 该processor会终结pipeline的后续processors,如果在该processor之后定义了其他processors,则会发出告警。
- 如果在pipeline中添加了一个exporter,则需要将其也添加到该processor中,否则不会生效。
- 由于该processor依赖HTTP首部或资源属性,因此需要谨慎在pipeline中使用aggregation processors(
batch或groupbytrace)
配置的必须参数如下:
from_attribute: HTTP header名称或资源属性名称,用于获取路由值。table: processor的路由表table.value:FromAttribute字段的可能值table.exporters: 如果FromAttribute字段值匹配table.value,则使用此处定义的exporters。
可选字段如下:
attribute_source: 定义from_attribute的属性来源:context(默认) - 查询 context(包含HTTP headers)。默认的from_attribute的数据来源,可以手动注入,或由第三方服务(如网关)注入。resource- 查询资源属性
drop_resource_routing_attribute- 是否移除路由所用的资源属性。default_exporters:无法匹配路由表的数据的exporters。
举例如下:
processors:routing:from_attribute: X-Tenantdefault_exporters:- jaegertable:- value: acmeexporters: [jaeger/acme]
exporters:jaeger:endpoint: localhost:14250jaeger/acme:endpoint: localhost:24250
Exporter
注意opentelemetry的Exporter大部分是push模式,需要发送到后端。
debug exporter
调试使用,可以将遥测数据输出到终端,配置参数如下:
verbosity:(默认basic),可选值为basic(输出摘要信息)、normal(输出实际数据)、detailed(输出详细信息)sampling_initial:(默认2),一开始每秒内输出的消息数sampling_thereafter:(默认1),在sampling_initial之后的采样率,1表示禁用该功能。即每秒内输出前sampling_initial个消息,然后再输出第sampling_thereafter个消息,丢弃其余消息。
exporters:debug:verbosity: detailedsampling_initial: 5sampling_thereafter: 200
otlp exporter
使用OTLP 格式,通过gRPC发送数据,注意这是push模式,默认需要TLS。可以选择设置retry和queue。
exporters:otlp:endpoint: otelcol2:4317tls:cert_file: file.certkey_file: file.keyotlp/2:endpoint: otelcol2:4317tls:insecure: true
otlp http exporter
通过HTTP发送OTLP 格式的数据,
endpoint: "https://1.2.3.4:1234"
tls:ca_file: /var/lib/mycert.pemcert_file: certfilekey_file: keyfileinsecure: true
timeout: 10s
read_buffer_size: 123
write_buffer_size: 345
sending_queue:enabled: truenum_consumers: 2queue_size: 10
retry_on_failure:enabled: trueinitial_interval: 10srandomization_factor: 0.7multiplier: 1.3max_interval: 60smax_elapsed_time: 10m
headers:"can you have a . here?": "F0000000-0000-0000-0000-000000000000"header1: "234"another: "somevalue"
compression: gzip
prometheus exporter
使用 Prometheus 格式暴露metrics,pull模式。
endpoint:暴露metrics的地址,路径为/metricsconst_labels: 为每个metrics追加的key/valuesnamespace: 如果设置,则指标暴露为<namespace>_<metrics>send_timestamps: 默认false,是否在响应中发送metrics的采集时间metric_expiration:默认5m,定义暴露的metrics无需更新的时长resource_to_telemetry_conversion:默认false,如果启用,则会将所有resource attributes转变为metric labelsenable_open_metrics:默认false,如果启用,则会使用OpenMetrics格式暴露metrics,可以支持Exemplars功能。add_metric_suffixes:默认true,如果false,则不会启用type和unit后缀。
exporters:prometheus:endpoint: "1.2.3.4:1234" # 暴露地址为:https://1.2.3.4:1234/metricstls:ca_file: "/path/to/ca.pem"cert_file: "/path/to/cert.pem"key_file: "/path/to/key.pem"namespace: test-spaceconst_labels:label1: value1"another label": spaced valuesend_timestamps: truemetric_expiration: 180menable_open_metrics: trueadd_metric_suffixes: falseresource_to_telemetry_conversion:enabled: true
推荐使用transform processor来将最常见的resource attribute设置为metric labels。
processor:transform:metric_statements:- context: datapointstatements:- set(attributes["namespace"], resource.attributes["k8s.namespace.name"])- set(attributes["container"], resource.attributes["k8s.container.name"])- set(attributes["pod"], resource.attributes["k8s.pod.name"])
prometheus remote write exporter
支持HTTP 设置和Retry 和 timeout 设置
用于将opentelemetry metrics发送到兼容prometheus remote wirte的后端,如Cortex、Mimir和thanos等。
配置参数如下:
endpoint:remote write URLtls:默认必须配置TLSinsecure:默认false。如需启动TLS,则需要配置cert_file和key_file
external_labels:为每个metric添加额外的label name和valueheaders:为每个HTTP 请求添加额外的header。add_metric_suffixes:默认true,如果false,则不会启用type和unit后缀。send_metadata:默认false,如果true,则会生成并发送prometheus metadataremote_write_queue:配置remote write的队列和发送参数enabled: 启动发送队列,默认truequeue_size: 入队列的OTLP指标数,默认10000num_consumers: 发送请求的最小workers数,默认5
resource_to_telemetry_conversion:默认false,如果true,则会将所有的resource attribute转变为metric labels。target_info:默认false,如果true,则会为每个resource指标生成一个target_info指标max_batch_size_bytes:默认3000000->~2.861 mb。发送给远端的batch采样数。如果一个batch大于该值,则会给切分为多个batches。
exporters:prometheusremotewrite:endpoint: "https://my-cortex:7900/api/v1/push"external_labels:label_name1: label_value1label_name2: label_value2resource_to_telemetry_conversion:enabled: true # Convert resource attributes to metric labels
推荐使用transform processor来将最常见的resource attribute设置为metric labels。
processor:transform:metric_statements:- context: datapointstatements:- set(attributes["namespace"], resource.attributes["k8s.namespace.name"])- set(attributes["container"], resource.attributes["k8s.container.name"])- set(attributes["pod"], resource.attributes["k8s.pod.name"])
loadbalancing exporter
基于routing_key实现spans, metrics 和 logs的负载均衡。如果不配置routing_key,则traces的默认值为traceID,metrics的默认值为service,即相同traceID(或service.name(当service作为routing_key))的spans会被发送到相同的后端。特别适用于tail-based samplers或red-metrics-collectors这种需要基于完整trace的后端。
需要注意的是负载均衡仅基于Trace ID或Service名称,且不会考虑实际后端的负载,也不会执行轮询负载均衡。
routing_key 的可选值为:
| routing_key | can be used for |
|---|---|
| service | logs, spans, metrics |
| traceID | logs, spans |
| resource | metrics |
| metric | metrics |
| streamID | metrics |
可以通过静态或DNS的方式配置后端。当更新后端时,会根据R/N(路由总数/后端总数)重新路由。如果后端经常变动,可以考虑使用groupbytrace processor。
需要注意的是,如果后端出现异常,此时loadbalancingexporter并不会尝试重新发送数据,存在数据丢失的可能,因此要求在exporter上配置queue和retry机制。
- 当resolver为
static时,如果一个后端不可用,则会所有后端的数据负载均衡失败,直到该后端恢复正常或从static列表中移除。dnsresolver也遵循相同的原则。 - 当使用
k8s、dns时,拓扑变更会最终反映到loadbalancingexporter上。
主要配置参数如下:
otlp:用于配置OTLP exporter。注意此处无需配置endpoint,该字段会被resolver的后端覆盖。resolver:可以配置一个static,一个dns,以及一个k8s或aws_cloud_map,但不能同时指定4个resolvers。dns中的hostname用于获取IP地址列表,port指用于导入traces的端口,默认为4317;interval指定解析间隔,如5s,1d,30m,默认5s;timeout指定解析超时时间,如5s,1d,30m,默认1sk8s中的service指kubernetes的service域名,如lb-svc.lb-ns。port指用于导入traces的端口,默认为4317,如果指定了多个端口,则会在loadbalancer中添加对应的backend,就像不同的pods一样;timeout指定解析超时时间,如5s,1d,30m,默认1s
routing_key:用于数据(spans或metrics)路由。目前仅支持trace和metrics类型。支持如下参数:service:基于service 名称进行路由。非常适用于span metrics,这样每个服务的所有spans都会被发送到一致的metrics Collector中。否则相同服务的metrics可能会被发送到不同的Collectors上,造成聚合不精确。traceID:根据traceID路由spans。metrics无效。metric:根据metric名称路由metrics。spans无效。streamID:根据数据的streamID路由metrics。streamID为对attributes和resource、scope和metrics数据哈希产生的唯一值。
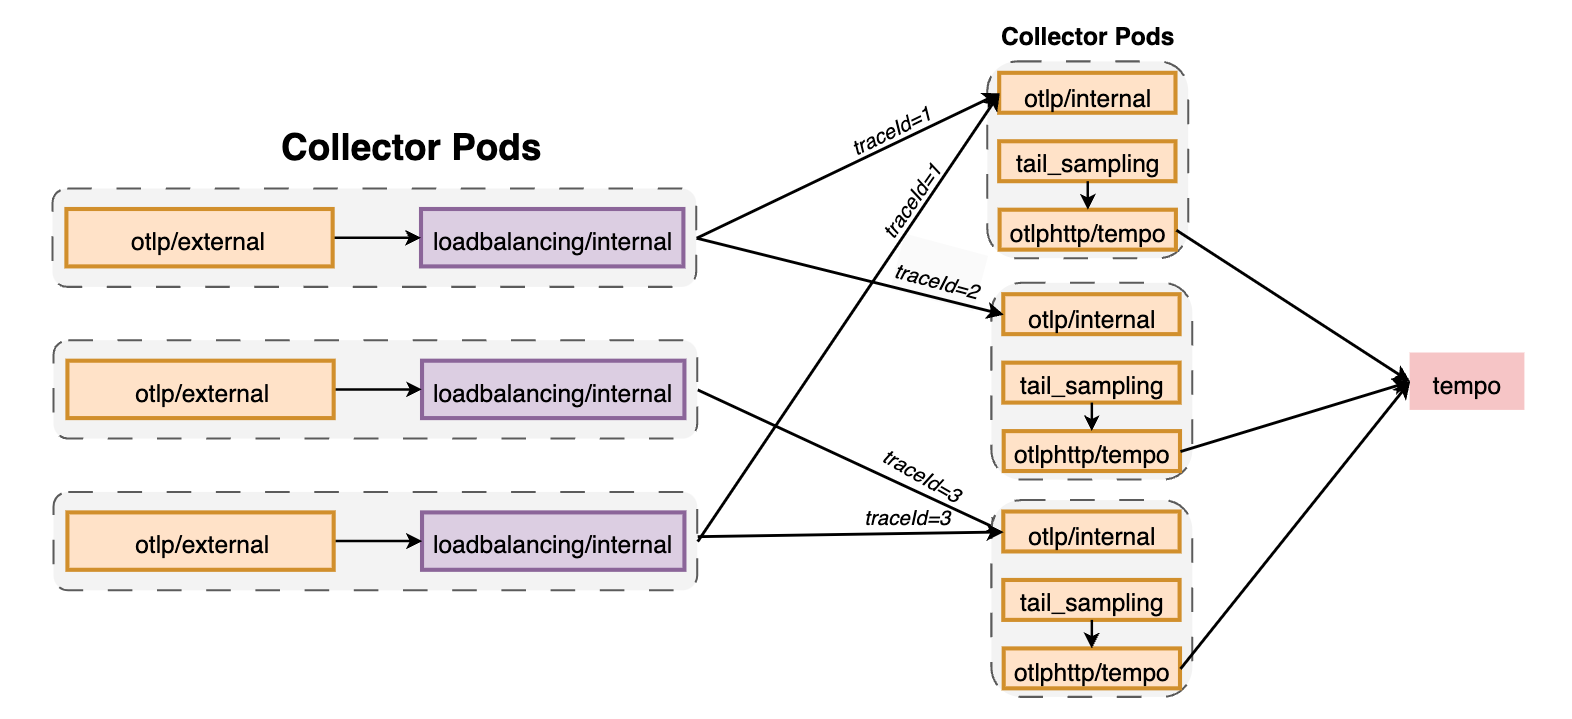
在下面例子中可以确保相同traceID的spans发送到相同的后端(Pod)上, :
receivers:otlp/external:protocols:grpc:endpoint: ${env:MY_POD_IP}:4317http:endpoint: ${env:MY_POD_IP}:4318otlp/internal:protocols:grpc:endpoint: ${env:MY_POD_IP}:14317http:endpoint: ${env:MY_POD_IP}:14318exporters:loadbalancing/internal:protocol:otlp:sending_queue:queue_size: 50000timeout: 1stls:insecure: trueresolver:k8s:ports:- 14317service: infrastructure-opentelemetry-tracingcollector.infrastructure-opentelemetrytimeout: 10sotlphttp/tempo:endpoint: http://infrastructure-tracing-tempo.net:14252/otlpsending_queue:queue_size: 50000tls:insecure: trueservice:pipelines:traces:exporters:- loadbalancing/internalprocessors:- memory_limiter- resource/metadatareceivers:- otlp/externaltraces/loadbalancing:exporters:- otlphttp/tempoprocessors:- memory_limiter- resource/metadata- tail_samplingreceivers:- otlp/internal
Connector
Connector可以将两个pipelines连接起来,使其中一个pipeline作为exporter,另一个作为receiver。connector可以看作一个exporter,从一个pipeline的尾部消费数据,从将数据发送到另一个pipeline开始处的receiver上。可以使用connector消费、复制或路由数据。
下面表示将traces的数据导入metrics中:
receivers:foo/traces:foo/metrics:
exporters:bar:
connectors:count:
service:pipelines:traces:receivers: [foo/traces]exporters: [count]metrics:receivers: [foo/metrics, count]exporters: [bar]
roundrobin connector
用于使用轮询方式实现负载均衡,适用于可扩展性不是很好的exporter,如prometheusremotewrite,下面用于将接收到的数据(metrics)以轮询方式分发到不同的prometheusremotewrite(metrics/1和metrics/2):
receivers:otlp:
processors:resourcedetection:batch:
exporters:prometheusremotewrite/1:prometheusremotewrite/2:
connectors:roundrobin:
service:pipelines:metrics:receivers: [otlp]processors: [resourcedetection, batch]exporters: [roundrobin]metrics/1:receivers: [roundrobin]exporters: [prometheusremotewrite/1]metrics/2:receivers: [roundrobin]exporters: [prometheusremotewrite/2]
span metrics connector
用于从span数据中聚合Request、Error和Duration(R.E.D) metrics。
-
Request:
calls{service.name="shipping",span.name="get_shipping/{shippingId}",span.kind="SERVER",status.code="Ok"} -
Error:
calls{service.name="shipping",span.name="get_shipping/{shippingId},span.kind="SERVER",status.code="Error"} -
Duration:
duration{service.name="shipping",span.name="get_shipping/{shippingId}",span.kind="SERVER",status.code="Ok"}
每条metric至少包含如下dimension(所有span都存在这些dimensions):
service.namespan.namespan.kindstatus.code
常见参数如下:
histogram:默认explicit,用于配置histogram,只能选择explicit或exponentialdisable:默认false,禁用所有histogram metricsunit:默认ms,可以选择ms或sexplicit:指定histogram的time bucket Duration。默认[2ms, 4ms, 6ms, 8ms, 10ms, 50ms, 100ms, 200ms, 400ms, 800ms, 1s, 1400ms, 2s, 5s, 10s, 15s]exponential:正负数范围内的最大bucket数
dimensions:除默认的dimensions之外还需添加的dimensions。每个dimension必须定一个name字段来从span的attributes集合或resource attribute中进行查找,如ip,host.name或region。如果没有在span中找到name属性,则查找default中定义的属性,如果没有定义default,则忽略此dimensionexclude_dimensions:从default dimensions中排除的dimensions列表。用于从metrics排除掉不需要的数据。dimensions_cache_size:保存Dimensions的缓存大小,默认1000。metrics_flush_interval:flush 生成的metrics的间隔,默认60s。metrics_expiration:如果在该时间内没有接收到任何新的spans,则不会再export metrics。默认0,表示不会超时。metric_timestamp_cache_size:,默认1000。events:配置events metrics。enable:默认falsedimensions:如果enable,则该字段必须存在。event metric的额外的Dimension
resource_metrics_key_attributes:过滤用于生成resource metrics key哈希值的resource attributes,可以防止resource attributes变动影响到Counter metrics。
receivers:nop:exporters:nop:connectors:spanmetrics:histogram:explicit:buckets: [100us, 1ms, 2ms, 6ms, 10ms, 100ms, 250ms]dimensions:- name: http.methoddefault: GET- name: http.status_codeexemplars:enabled: trueexclude_dimensions: ['status.code']dimensions_cache_size: 1000aggregation_temporality: "AGGREGATION_TEMPORALITY_CUMULATIVE" metrics_flush_interval: 15smetrics_expiration: 5mevents:enabled: truedimensions:- name: exception.type- name: exception.messageresource_metrics_key_attributes:- service.name- telemetry.sdk.language- telemetry.sdk.nameservice:pipelines:traces:receivers: [nop]exporters: [spanmetrics]metrics:receivers: [spanmetrics]exporters: [nop]
troubleshooting
- 使用 debug exporter
- 使用 pprof extension,暴露端口为
1777,采集pprof数据 - 使用 zPages extension, 暴露端口为
55679,地址为/debug/tracez可以定位如下问题:- 延迟问题
- 死锁和工具问题
- 错误
扩容
何时扩容
- 当使用
memory_limiterprocessor时,可以通过otelcol_processor_refused_spans来检查内存是否充足 - Collector会使用queue来保存需要发送的数据,如果
otelcol_exporter_queue_size>otelcol_exporter_queue_capacity则会拒绝数据(otelcol_exporter_enqueue_failed_spans) - 此外特定组件也会暴露相关metrics,如
otelcol_loadbalancer_backend_latency
如何扩容
对于扩容,可以将组件分为三类:stateless、scrapers 和 stateful。对于stateless来说只需要增加副本数即可。
scrapers
对于hostmetricsreceiver和prometheusreceiver这样的receivers,不能简单地增加实例数,否则会导致每个Collector都scrape系统的endpoints。可以通过Target Allocator来对endpoints进行分片。
stateful
对于某些将数据存放在内存中的组件来说,扩容可能会导致不同的结果。如tail-sampling processor,它会在内存中保存一定时间的spans数据,并在认为trace结束时评估采样决策。如果通过增加副本数来对此类Collector进行扩容,就会导致不同的Collectors接收到相同trace的spans,导致每个Collector都会评估是否应该对该trace进行采样,从而可能得到不同的结果(trace丢失spans)。
类似的还有span-to-metrics processor,当不同的Collectors接收到相同服务的数据时,基于service name聚合就会变得不精确。
为了避免该问题,可以在执行tail-sampling 或 span-to-metrics 前面加上 load-balancing exporter, load-balancing exporter会根据trace ID 或service name获取哈希值,保证后端的Collector接收到一致的数据。
receivers:otlp:protocols:grpc:endpoint: 0.0.0.0:4317processors:exporters:loadbalancing:protocol:otlp:resolver:dns:hostname: otelcol.observability.svc.cluster.localservice:pipelines:traces:receivers:- otlpprocessors: []exporters:- loadbalancing

![无缝融入,即刻智能[一]:Dify-LLM大模型平台,零编码集成嵌入第三方系统,42K+星标见证专属智能方案[含ollama部署]](https://ai-studio-static-online.cdn.bcebos.com/0cc6fc169d9a47e7ba513461db718e6e8c79738f966a46a4988895b6338c116c)


![洛谷题单指南-前缀和差分与离散化-P5937 [CEOI1999] Parity Game](https://img2024.cnblogs.com/blog/3330618/202408/3330618-20240811214507542-1176955877.png)
