[20250128]21C下测试CBC latch相关测试5.txt
--//元旦前别人问的问题,看vage的<oracle内核技术揭秘>,里面提到的各种情况,实际上从11.2.0.4开始全表扫描,唯一索引,rowid
--//模式以及快速全索引扫描的读读模式下(共享模式)基本不会出现cbc latch,如果出现也许不巧遇到读取cbc latch链时其它 sql 语
--//句修改或者某种操作读取其链表上其它数据块,出现cbc latch。
--//我看了我以前的测试笔记,在21c验证看看是否存在一些变化。
--//最后的结论:21c下基本在读读模式下基本不会出现cbc latch等待事件。
--//前几天测试写的脚本是顺序执行的,不具有通用性,修改一下顺便测试看看。
1.环境:
SCOTT@book01p> @ ver2
==============================
PORT_STRING : x86_64/Linux 2.4.xx
VERSION : 21.0.0.0.0
BANNER : Oracle Database 21c Enterprise Edition Release 21.0.0.0.0 - Production
BANNER_FULL : Oracle Database 21c Enterprise Edition Release 21.0.0.0.0 - Production
Version 21.3.0.0.0
BANNER_LEGACY : Oracle Database 21c Enterprise Edition Release 21.0.0.0.0 - Production
CON_ID : 0
PL/SQL procedure successfully completed.
2.建立测试环境:
SCOTT@book01p> create table job_times (sid number, time_ela number,method varchar2(20));
Table created.
SCOTT@book01p> create table t as select rownum id ,cast('test' as varchar2(10)) name from dual ;
Table created.
SCOTT@book01p> alter table t modify ( id not null );
Table altered.
SCOTT@book01p> create index i_t_id on t(id);
Index created.
--//create unique index i_t_id on t(id);
--//分析表略。
SCOTT@book01p> select rowid from t;
ROWID
------------------
AAAYbIAAMAAAAEDAAA
SCOTT@book01p> @ rowid AAAYbIAAMAAAAEDAAA
DATA_OBJECT_ID FILE BLOCK ROW ROWID_DBA DBA TEXT
-------------- ---------- ---------- ---------- -------------------- -------------------- --------------------------------------------------
100040 12 259 0 0x3000103 12,259 alter system dump datafile 12 block 259 ;
$ nl loop.txt
1 declare
2 v_id number;
3 v_d date;
4 begin
5 for i in 1 .. &&1 loop
6 --select /*+ full(t) &&3 */ count (name) into v_id from t ;
7 --select /*+ ROWID(t) &&3 */ count (name) into v_id from t where rowid='AAAYbIAAMAAAAEDAAA';
8 --select /*+ index(t) &&3 */ count (name) into v_id from t ;
9 --select /*+ index(t) &&3 */ count (name) into v_id from t where id=1;
10 --select /*+ index_ffs(t) &&3 */ count (*) into v_id from t ;
11 --select /*+ index_ffs(t) &&3 */ count (name) into v_id from t ;
12 --select /*+ ROWID(t) &&3 */ count (name) into v_id from t where rowid between 'AAAYbIAAMAAAAEDAAA' and 'AAAYbIAAMAAAAEDAAB';
13 end loop;
14 end ;
15 /
$ cp loop.txt loop.org
--//做1个备份。
$ cat record.txt
set verify off
variable v_method varchar2(20)
exec :v_method := '&&2';
define t=&&1;
@@ loop.txt 5 &&2
insert into job_times values ( sys_context ('userenv', 'sid') ,dbms_utility.get_time ,'&&2') ;
commit ;
@@ loop.txt &&t &&2
update job_times set time_ela = dbms_utility.get_time - time_ela where sid=sys_context ('userenv', 'sid') and method= :v_method;
commit;
quit
--//简单说明:
--//每次测试前我都单独执行要测试sql语句5次。
--//注:唯一索引与非唯一索引分开测试。在提示中加入 &&3,主要避免出现cursor: pin S等待事件。
--//以前测试时分别注解上面的部分,这次通过编写脚本1次完成,事后分析。
$ cat cbc2.sh
#!/bin/bash
v_conn=scott/book@book01p
v_test="p1full p1rowid p1index_fs p1not_uniindex p1indexffs p1indexffs_name p1rowidbetween"
v_line=6
sqlplus -s -l ${v_conn} <<EOF > /dev/null
drop index i_t_id;
create index i_t_id on t(id);
quit
EOF
sleep 1
for ii in $v_test
do
sed -e "${v_line}s/ --select/ select/" loop.org >| loop.txt
sleep 3
zzdate
seq 50 | xargs -I{} -P 50 sqlplus -s -l ${v_conn} @record.txt 1e5 ${ii}=50 {} >/dev/null
zzdate
((v_line++))
sleep 3
done
sqlplus -s -l ${v_conn} <<EOF > /dev/null
drop index i_t_id;
create unique index i_t_id on t(id);
quit
EOF
sleep 1
v_conn=scott/book@book01p
v_test="p2full p2rowid p2index_fs p2uniindex p2indexffs p2indexffs_name p2rowidbetween"
v_line=6
for ii in $v_test
do
sed -e "${v_line}s/ --select/ select/" loop.org >| loop.txt
sleep 3
zzdate
seq 50 | xargs -I{} -P 50 sqlplus -s -l ${v_conn} @record.txt 1e5 ${ii}=50 {} >/dev/null
zzdate
((v_line++))
sleep 3
done
3.测试:
--//delete from job_times ;
--//commit ;
$ ./cbc2.sh
trunc(sysdate)+15/24+51/1440+41/86400 1738309901.866128439 --//p1full=50
trunc(sysdate)+15/24+52/1440+15/86400 1738309935.589019338 --//p1full=50
trunc(sysdate)+15/24+52/1440+21/86400 1738309941.602397560 --//p1rowid=50
trunc(sysdate)+15/24+52/1440+44/86400 1738309964.033334966 --//p1rowid=50
trunc(sysdate)+15/24+52/1440+50/86400 1738309970.056889505 --//p1index_fs=50
trunc(sysdate)+15/24+53/1440+17/86400 1738309997.670372914 --//p1index_fs=50
trunc(sysdate)+15/24+53/1440+23/86400 1738310003.698719931 --//p1not_uniindex=50
trunc(sysdate)+15/24+53/1440+51/86400 1738310031.984141857 --//p1not_uniindex=50
trunc(sysdate)+15/24+53/1440+58/86400 1738310038.006265731 --//p1indexffs=50
trunc(sysdate)+15/24+54/1440+28/86400 1738310068.625749964 --//p1indexffs=50
trunc(sysdate)+15/24+54/1440+34/86400 1738310074.649780188 --//p1indexffs_name=50
trunc(sysdate)+15/24+55/1440+02/86400 1738310102.426901359 --//p1indexffs_name=50
trunc(sysdate)+15/24+55/1440+08/86400 1738310108.459568675 --//p1rowidbetween=50
trunc(sysdate)+15/24+56/1440+01/86400 1738310161.221741315 --//p1rowidbetween=50
trunc(sysdate)+15/24+56/1440+08/86400 1738310168.904871134 --//p2full=50
trunc(sysdate)+15/24+56/1440+42/86400 1738310202.628110965 --//p2full=50
trunc(sysdate)+15/24+56/1440+48/86400 1738310208.650691446 --//p2rowid=50
trunc(sysdate)+15/24+57/1440+10/86400 1738310230.620899334 --//p2rowid=50
trunc(sysdate)+15/24+57/1440+16/86400 1738310236.645815987 --//p2index_fs=50
trunc(sysdate)+15/24+57/1440+44/86400 1738310264.315145405 --//p2index_fs=50
trunc(sysdate)+15/24+57/1440+50/86400 1738310270.344066349 --//p2uniindex=50
trunc(sysdate)+15/24+58/1440+15/86400 1738310295.138286658 --//p2uniindex=50
trunc(sysdate)+15/24+58/1440+21/86400 1738310301.170380645 --//p2indexffs=50
trunc(sysdate)+15/24+58/1440+51/86400 1738310331.735310144 --//p2indexffs=50
trunc(sysdate)+15/24+58/1440+57/86400 1738310337.764016288 --//p2indexffs_name=50
trunc(sysdate)+15/24+59/1440+25/86400 1738310365.409580747 --//p2indexffs_name=50
trunc(sysdate)+15/24+59/1440+31/86400 1738310371.434929589 --//p2rowidbetween=50
trunc(sysdate)+16/24+00/1440+23/86400 1738310423.884724199 --//p2rowidbetween=50
SYS@book> @ ashtop event 1=1 trunc(sysdate)+15/24+51/1440+41/86400 trunc(sysdate)+16/24+00/1440+23/86400
Total Distinct Distinct Distinct
Seconds AAS %This EVENT FIRST_SEEN LAST_SEEN Execs Seen Tstamps Execs Seen1
--------- ------- ------- ------------------------ ------------------- ------------------- ---------- -------- -----------
18621 35.7 100% | 2025-01-31 15:51:41 2025-01-31 16:00:22 11454 447 11899
26 .0 0% | log file sync 2025-01-31 15:51:43 2025-01-31 16:00:19 1 25 25
8 .0 0% | log file parallel write 2025-01-31 15:52:43 2025-01-31 15:58:58 1 8 8
2 .0 0% | latch: shared pool 2025-01-31 15:57:41 2025-01-31 15:59:01 1 2 2
1 .0 0% | oracle thread bootstrap 2025-01-31 16:00:02 2025-01-31 16:00:02 1 1 1
1 .0 0% | os thread creation 2025-01-31 16:00:02 2025-01-31 16:00:02 1 1 1
6 rows selected.
--//没有latch: cache buffers chains等待事件。
COTT@book01p> Select method,count(*),round(avg(TIME_ELA),2),sum(TIME_ELA) from job_times group by method order by 3 ;
METHOD COUNT(*) ROUND(AVG(TIME_ELA),2) SUM(TIME_ELA)
-------------------- ---------- ---------------------- -------------
p2rowid=50 50 1720.24 86012
p1rowid=50 50 1765.52 88276
p2uniindex=50 50 1984.92 99246
p2index_fs=50 50 2280.64 114032
p1index_fs=50 50 2280.86 114043
p2indexffs_name=50 50 2285.90 114295
p1indexffs_name=50 50 2295.26 114763
p1not_uniindex=50 50 2337.68 116884
p2indexffs=50 50 2565.56 128278
p1indexffs=50 50 2571.90 128595
p1full=50 50 2856.22 142811
p2full=50 50 2862.62 143131
p2rowidbetween=50 50 4689.38 234469
p1rowidbetween=50 50 4768.18 238409
14 rows selected.
--//2次测试结果基本一致。pXindex_fs,pxindexffs_name都是index full scan,执行计划一样,交错出现很正常。
--//你可以反复测试,注意几点测试前删除job_times历史记录.
[20250128]21C下测试CBC latch相关测试5.txt
本文来自互联网用户投稿,该文观点仅代表作者本人,不代表本站立场。本站仅提供信息存储空间服务,不拥有所有权,不承担相关法律责任。如若转载,请注明出处:http://www.hqwc.cn/news/879254.html
如若内容造成侵权/违法违规/事实不符,请联系编程知识网进行投诉反馈email:809451989@qq.com,一经查实,立即删除!相关文章

基于Python的Selenium详细教程
本文使用环境:windows11、Python 3.10.5、PyCharm 2022.1.3、Selenium 4.3.0
需要你懂的技术:Python、HTML、CSS、JavaScript一、PyCharm安装配置Selenium本文使用环境:windows11、Python 3.10.5、PyCharm 2022.1.3、Selenium 4.3.0需要你懂的技术:Python、HTML、CSS、Java…


海外社交媒体运营卡成狗?云手机一键“救场”
海外社交媒体运营卡成狗?云手机一键“救场”
在海外社交媒体运营中,运营人员往往会遇到各种挑战,导致运营效率低下,甚至感觉“卡成狗”。而云手机作为一种流行的成熟普及技术工具,可以为海外社交媒体运营带来一定的帮助,实现一键“救场”。以下是对云手机在海外社交媒体运…
MyBatis resultmap结果映射
创建数据库和实体类
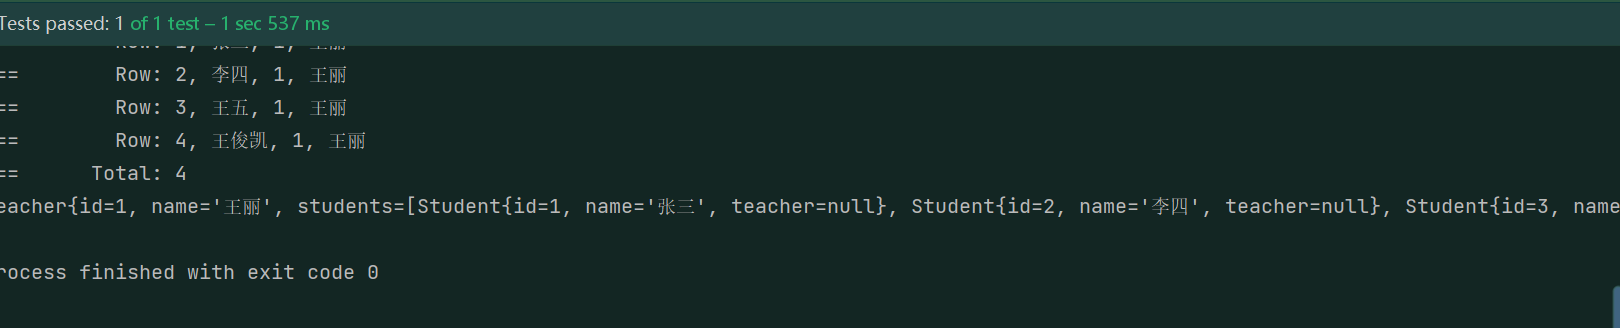
首先创建数据库student和teacher,并且每个学生对应一个老师,一个老师可以对应多个学生,数据库如下图: 创建实体类Student1 package com.loubin.pojo;2 3 public class Student {4 private int id;5 private String name;6 7 Teacher teach…
Linguistics-English-Textbooks: 上海外教社: 高校英语专业系列教材(修订版)
新世纪高校英语专业系列教材(修订版)
https://we.sflep.com/books/newcenturymajor1.aspx教材特色
配套资源
特点
秉以新《国标》指导下的英语专业课程改革为导向精心架构,体系完备。
凝聚海内外英语专业教育界专家学者智慧,教材编写高屋建瓴、深入 浅出.
兼顾语言基本技能…

OCRmyPDF: 让图片 PDF 可复制、搜索的神器
翻开十年前的工作报告,面对泛黄的纸质合同,整理成摞的文献资料 - 这些场景总离不开扫描仪,将纸张材料转成 PDF 扫描件电子版。
但生成的 PDF 文件像一张张定格照片,既不能复制文字,也无法搜索关键词。
图片
今天推荐的开源项目:OCRmyPDF 专治各种"哑巴PDF"。它…

独立开发经验谈:我是如何借助 Docker 环境变量让客户 1 分钟上线客服系统的
通过 Docker 环境变量,在启动容器时带入配置信息,自动写入配置文件中,完全免去了进入容器内部 vim 修改的步骤,真正实现在线客服系统1分钟上线。我在业余时间开发了一款自己的独立产品:升讯威在线客服与营销系统。陆陆续续开发了几年,从一开始的偶有用户尝试,到如今线上…