Prometheus是一种开源监控系统,可用于收集指标和统计数据,并提供强大的查询语言,以便分析和可视化这些数据。它被广泛用于云原生和容器化环境中,可以嵌入到Kubernetes集群中,并与其他Kubernetes工具进行集成。
Grafana是一种开源的面向数据的仪表板和可视化工具,可与Prometheus等数据源一起使用。它提供了各种可视化选项和插件,可以可视化数据和指标以便于分析。Grafana还支持警报和通知机制,以便在指标达到特定条件时通知用户。
结合使用Prometheus和Grafana可以实现实时监控应用程序的运行状况,帮助开发人员迅速发现和解决问题。通过可视化和分析指标数据,可以对系统性能和稳定性进行深入了解,并且可以根据警告和通知及时采取行动。
实验部署
| IP | 角色 | 系统 | 规格 |
|---|---|---|---|
| 192.168.231.233 | Prometheus 服务端 | CentOS 7 | 4c8g |
| 192.168.231.232 | node_exporter 客户端 | CentOS 7 | 4c8g |
在服务端部署prometheus
由于本地有包 因此直接上传rz
选择这个prometheus-2.47.2.linux-amd64.tar.gz解压
[root@prometheus opt]# tar xvfz prometheus-2.47.2.linux-amd64.tar.gz -C /usr/local/
[root@prometheus opt]# cd /usr/local/改名
[root@prometheus local]# mv prometheus-2.47.2.linux-amd64 prometheus
[root@prometheus local]# cd prometheus
[root@prometheus prometheus]# ls
console_libraries  consoles  data  LICENSE  NOTICE  prometheus  prometheus.yml  promtool# 查看版本信息
[root@prometheus prometheus]# ./prometheus --version
prometheus, version 2.47.2 (branch: HEAD, revision: 3f3172cde1ee37f1c7b3a5f3d9b031190509b3ad)build user:       root@79f2ad339b75build date:       20231012-16:07:10go version:       go1.21.3platform:         linux/amd64tags:             netgo,builtinassets,stringlabels
# 查看帮助
[root@prometheus prometheus]# ./prometheus --help
prometheus, version 2.47.2 (branch: HEAD, revision: 3f3172cde1ee37f1c7b3a5f3d9b031190509b3ad)build user:       root@79f2ad339b75build date:       20231012-16:07:10go version:       go1.21.3platform:         linux/amd64tags:             netgo,builtinassets,stringlabels…………
prometheus.yml配置文件详细解释
[root@prometheus prometheus]# cat prometheus.yml
# my global config
global:# 默认情况下,每15s拉取一次目标采样点数据。scrape_interval:     15s # Set the scrape interval to every 15 seconds. Default is every 1 minute.# 每15秒评估一次规则。默认值为每1分钟。evaluation_interval: 15s # Evaluate rules every 15 seconds. The default is every 1 minute.# scrape_timeout is set to the global default (10s).# Alertmanager configuration
alerting:alertmanagers:- static_configs:- targets:# - alertmanager:9093# Load rules once and periodically evaluate them according to the global 'evaluation_interval'.
rule_files:# - "first_rules.yml"# - "second_rules.yml"# A scrape configuration containing exactly one endpoint to scrape:
# Here it's Prometheus itself.
scrape_configs:# job名称会增加到拉取到的所有采样点上,同时还有一个instance目标服务的host:port标签也会增加到采样点上- job_name: 'prometheus'# 覆盖global的采样点,拉取时间间隔5sscrape_interval: 5sstatic_configs:- targets: ['localhost:9090']
启动Prometheus
[root@prometheus prometheus]# ./prometheus --config.file=prometheus.yml相关启动参数
# 指定配置文件
--config.file="prometheus.yml"
# 默认指定监听地址端口,可修改端口
--web.listen-address="0.0.0.0:9090"
# 最大连接数
--web.max-connections=512
# tsdb数据存储的目录,默认当前data/
--storage.tsdb.path="data/"
# premetheus 存储数据的时间,默认保存15天
--storage.tsdb.retention=15d
# 通过命令热加载无需重启 curl -XPOST 192.168.2.45:9090/-/reload
--web.enable-lifecycle
# 可以启用 TLS 或 身份验证 的配置文件的路径
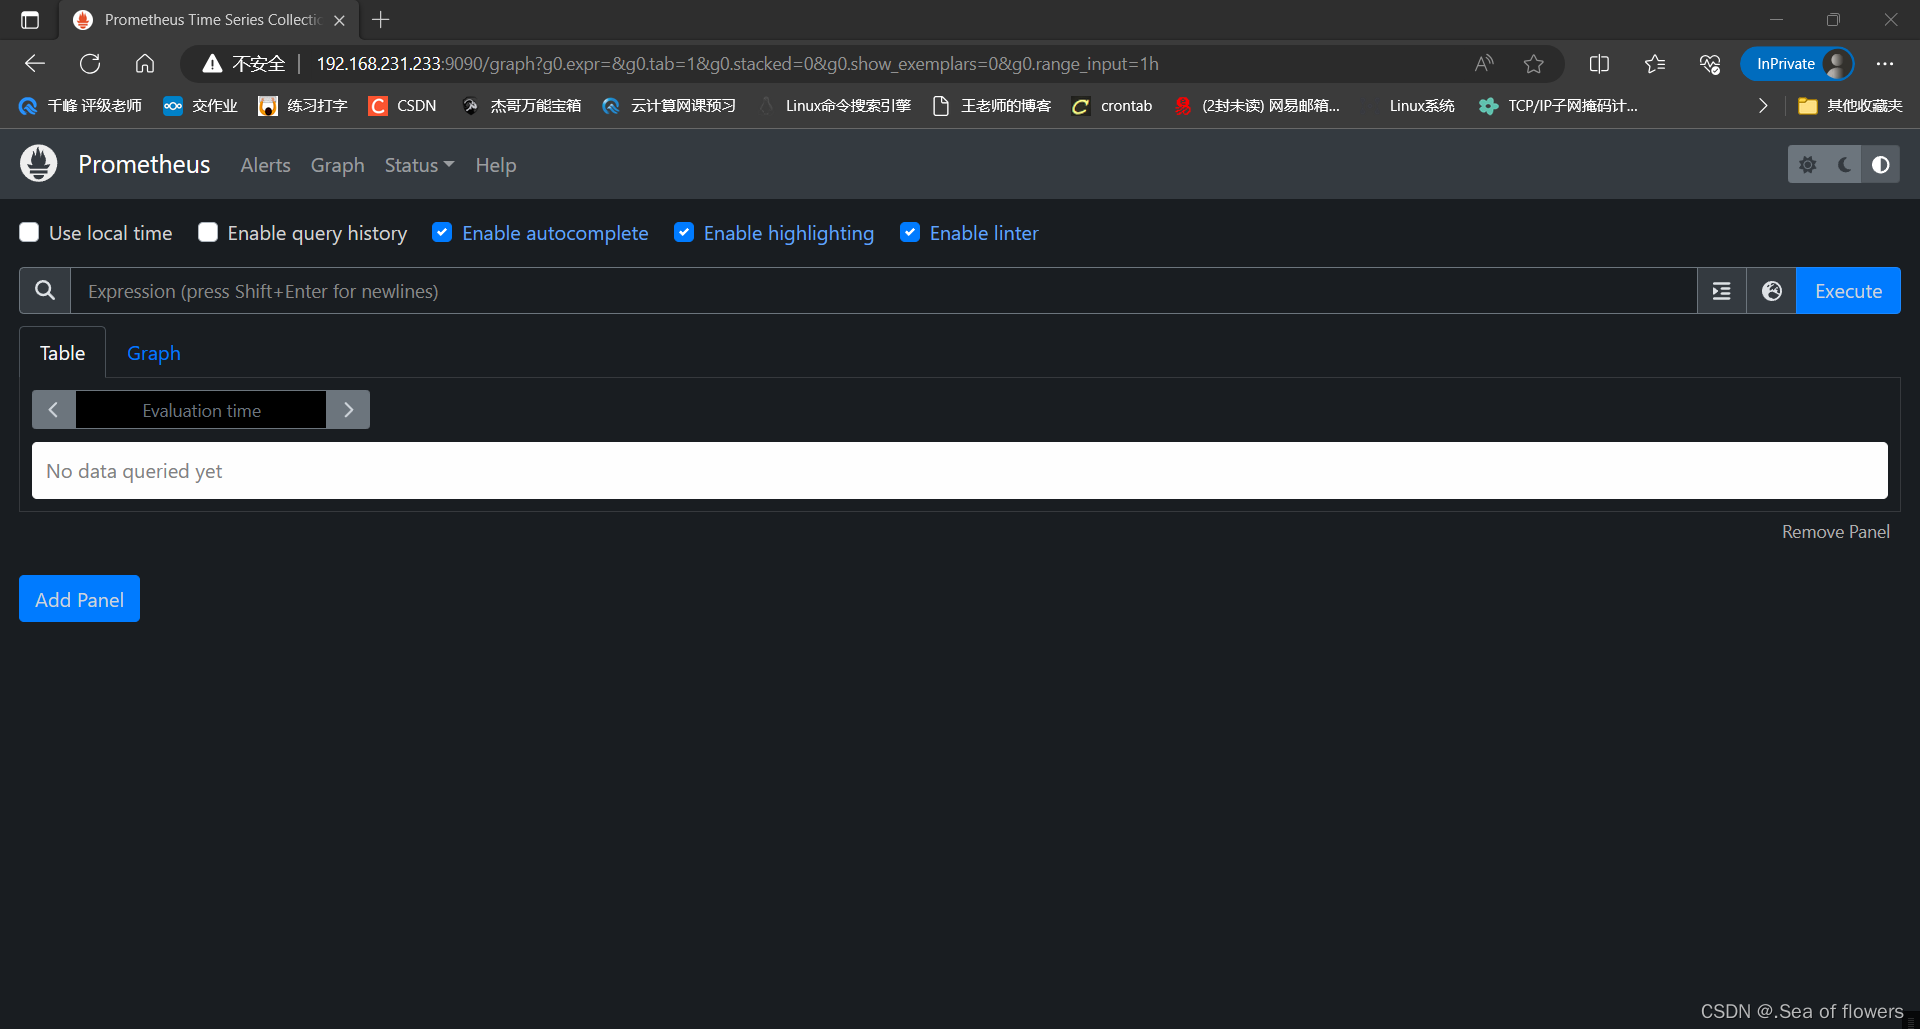
--web.config.file=""启动选项了解:./prometheus --helpweb端访问
192.168.231.233:9090
将Prometheus配置为system管理
# 配置Prometheus启动文件
[root@prometheus opt]# vim /usr/lib/systemd/system/prometheus.service
[Unit]
Description=https://prometheus.io[Service]
Restart=on-failure
ExecStart=/usr/local/prometheus/prometheus --config.file=/usr/local/prometheus/prometheus.yml --web.listen-address=:9090[Install]
WantedBy=multi-user.target
重新加载system配置
[root@prometheus opt]# systemctl daemon-reload
[root@prometheus opt]# systemctl start prometheus查看端口
[root@prometheus opt]# ss -tlanp |grep 9090
LISTEN     0      1024      [::]:9090                  [::]:*                   users:(("prometheus",pid=9318,fd=7))
客户端,配置服务发现linux主机及相关服务
# 安装node_exporter
传包
rz   #node_exporter-1.7.0.linux-amd64.tar.gz解压
[root@node ~]# tar -xr node_exporter-1.7.0.linux-amd64.tar.gz -C /usr/local/
[root@node ~]# cd /usr/local/
[root@node local]# mv node_exporter-1.7.0.linux-amd64/ node_exporter进入目录,查看有哪些文件
[root@node local]# cd node_exporter/
[root@node node_exporter]# ls
LICENSE  node_exporter  NOTICE后台运行并启动
[root@node node_exporter]# ./node_exporter &…………
ts=2023-11-16T09:52:04.979Z caller=tls_config.go:274 level=info msg="Listening on" address=[::]:9100
ts=2023-11-16T09:52:04.979Z caller=tls_config.go:277 level=info msg="TLS is disabled." http2=false address=[::]:9100
查看端口
[root@node node_exporter]# ss -tlnp  | grep 9100
LISTEN     0      1024      [::]:9100                  [::]:*                   users:(("node_exporter",pid=8414,fd=3))
配置node——exporter为systemd管理
[root@node node_exporter]# vim /usr/lib/systemd/system/node_exporter.service
[Unit]
Description=node_exporter
After=network.target [Service]
ExecStart=/usr/local/node_exporter/node_exporter
Restart=on-failure[Install]
WantedBy=multi-user.target
重新加载配置,并查看端口
[root@node node_exporter]# systemctl daemon-reload
[root@node node_exporter]# systemctl start node_exporter
[root@node node_exporter]# ss -tlnp  | grep 9100
LISTEN     0      1024      [::]:9100                  [::]:*                   users:(("node_exporter",pid=8675,fd=3))
普罗米修斯服务端配置文件添加监控项
vim /usr/local/prometheus/prometheus.yml最后一行添加- job_name: "node_exporter"static_configs:- targets: ["192.168.231.232:9100"]# 如果有多个机器,用','分开
重启prometheus服务
[root@prometheus prometheus]# systemctl restart prometheus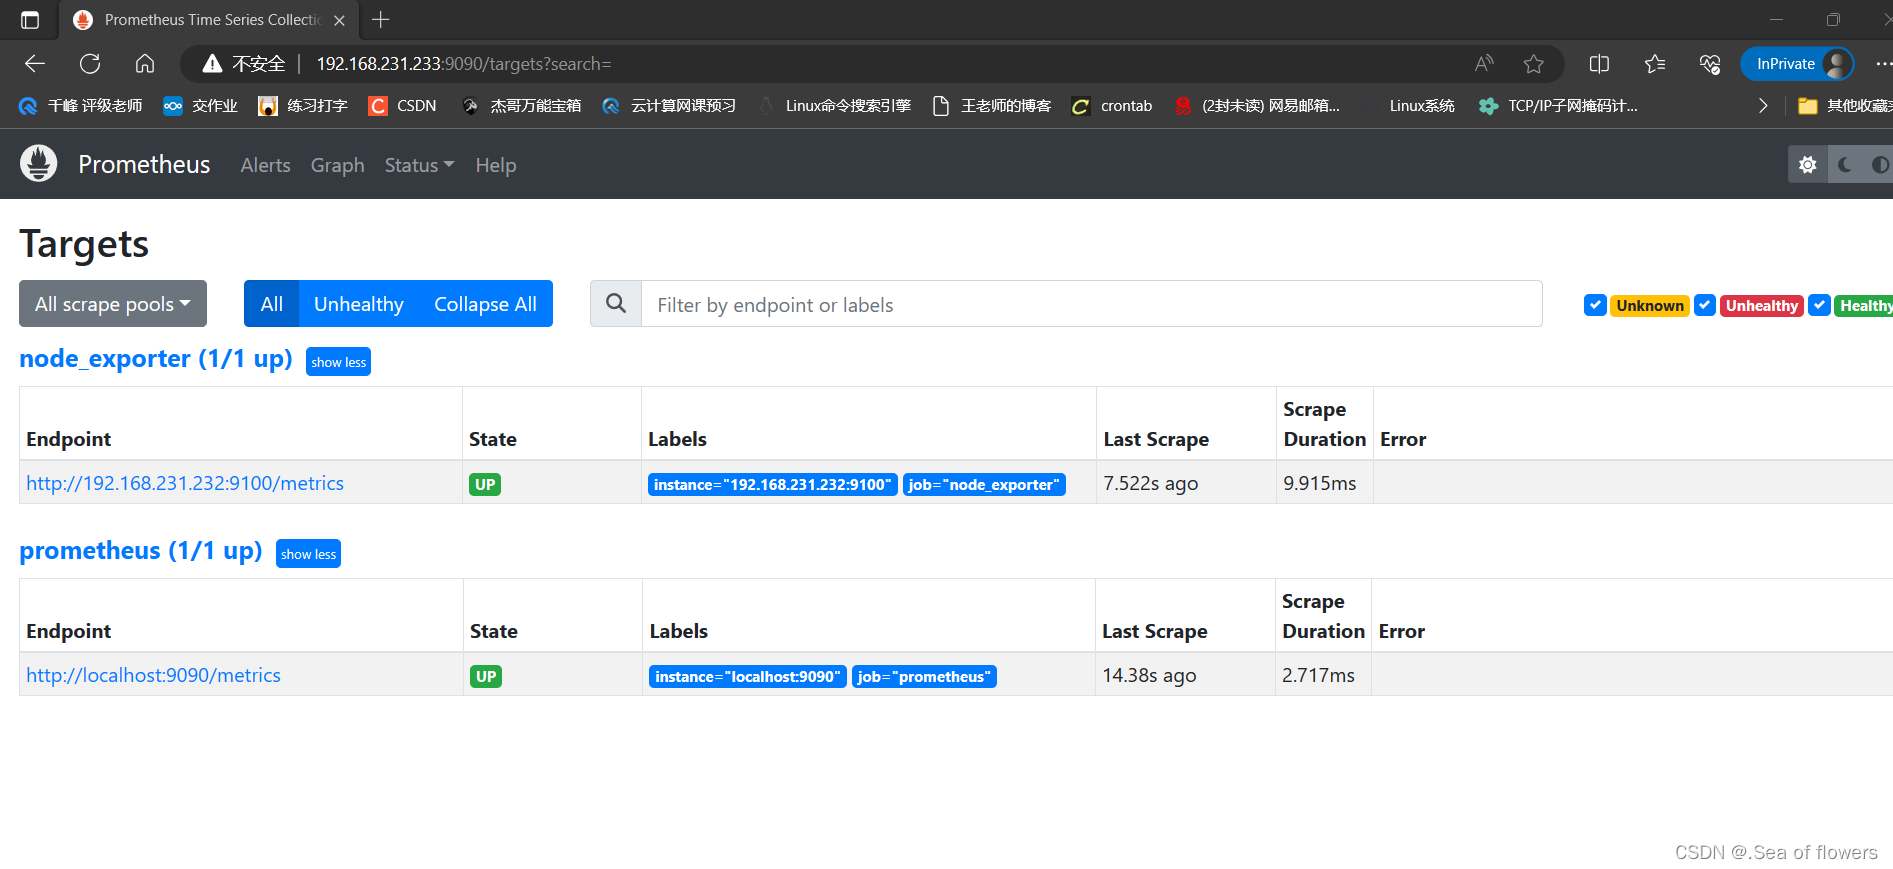
监控mysql(mysqld-exported)
安装mysqld-exported
rz  上传包解压
[root@node ~]# tar xf mysqld_exporter-0.15.0.linux-amd64.tar.gz -C /usr/local/
改名
[root@node /usr/local]# mv mysqld_exporter-0.15.0.linux-amd64 mysqld_exporter
编辑文件
[root@node /usr/local/mysqld_exporter]# vim .my.cnf
[client]
user=root
password=123   #登录系统用户的密码
启动mysqld-exported
后台运行
[root@node /usr/local/mysqld_exporter]# ./mysqld_exporter --config.my-cnf="/usr/local/mysqld_exporter/.my.cnf" &查看进程
[root@node /usr/local/mysqld_exporter]# ps -ef |grep mysqld_exporter
root       3447   3398  0 01:31 pts/1    00:00:02 ./node_exporter
root       4647   3398  0 02:13 pts/1    00:00:00 ./mysqld_exporter --config.my-cnf=/usr/local/mysqld_exporter/.my.cnf查看端口
[root@node /usr/local/mysqld_exporter]# ss -lntp |grep 4647
LISTEN     0      128         :::9104                    :::*                   users:(("mysqld_exporter",pid=4647,fd=3))
[root@VM_2-44 /usr/local/mysqld_exporter]#
# 启动后会监听9104端口
普罗米修斯服务端配置文件添加监控项
[root@prometheus prometheus]# vim prometheus.yml - job_name: "mysql-exporter"static_configs:- targets: ["192.168.231.232:9104"]
重启服务
[root@prometheus prometheus]# systemctl restart prometheus使用grafana展示Prometheus数据,在服务端安装
上传grafana-10.0.0-1.x86_64.rpm
rz安装
[root@prometheus ~]# yum install initscripts fontconfig -y
[root@prometheus ~]# yum install -y grafana-10.0.0-1.x86_64.rpm启动服务
[root@prometheus ~]# systemctl start grafana-server.service 查看端口
[root@prometheus ~]# ss -tlanp |grep grafana |grep LISTEN
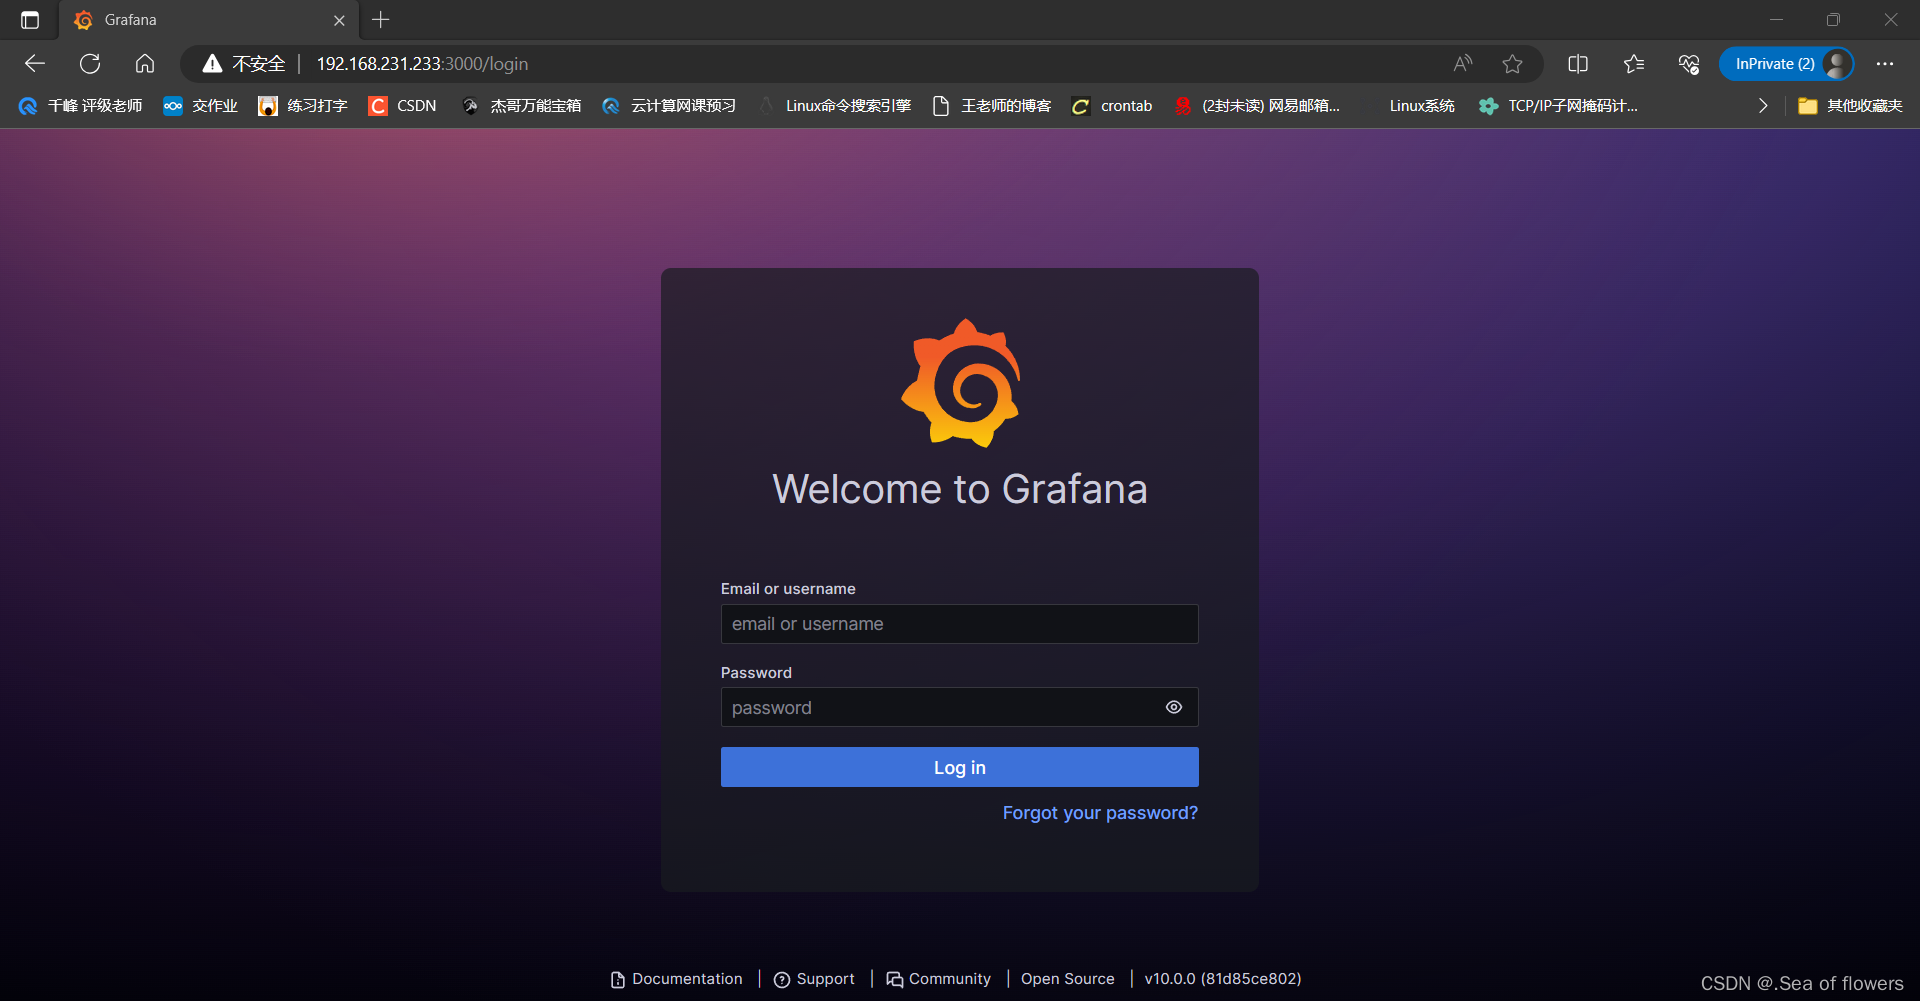
LISTEN 0 1024 [::]:3000 [::]:* users:(("grafana",pid=10629,fd=11))# 启动后访问地址:ip:3000
# 初始用户名和密码都是admin
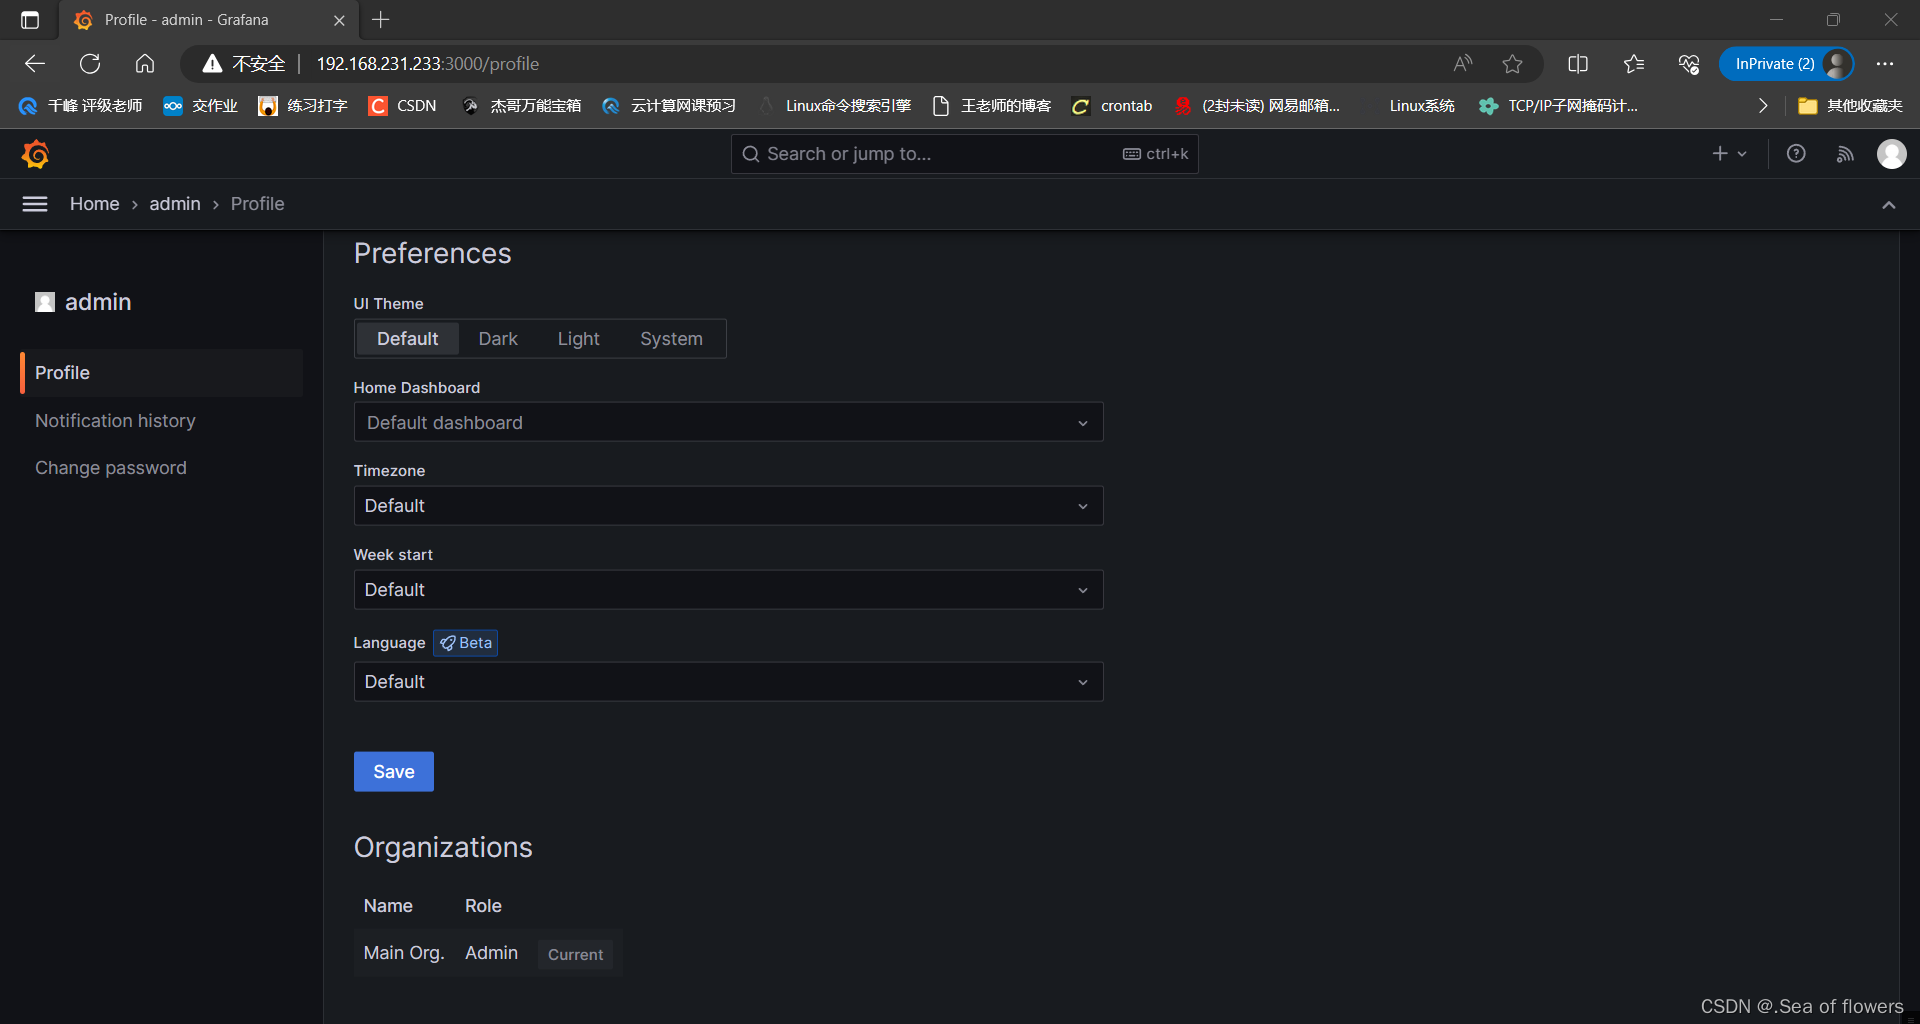
浏览器访问 http://192.168.231.233:3000
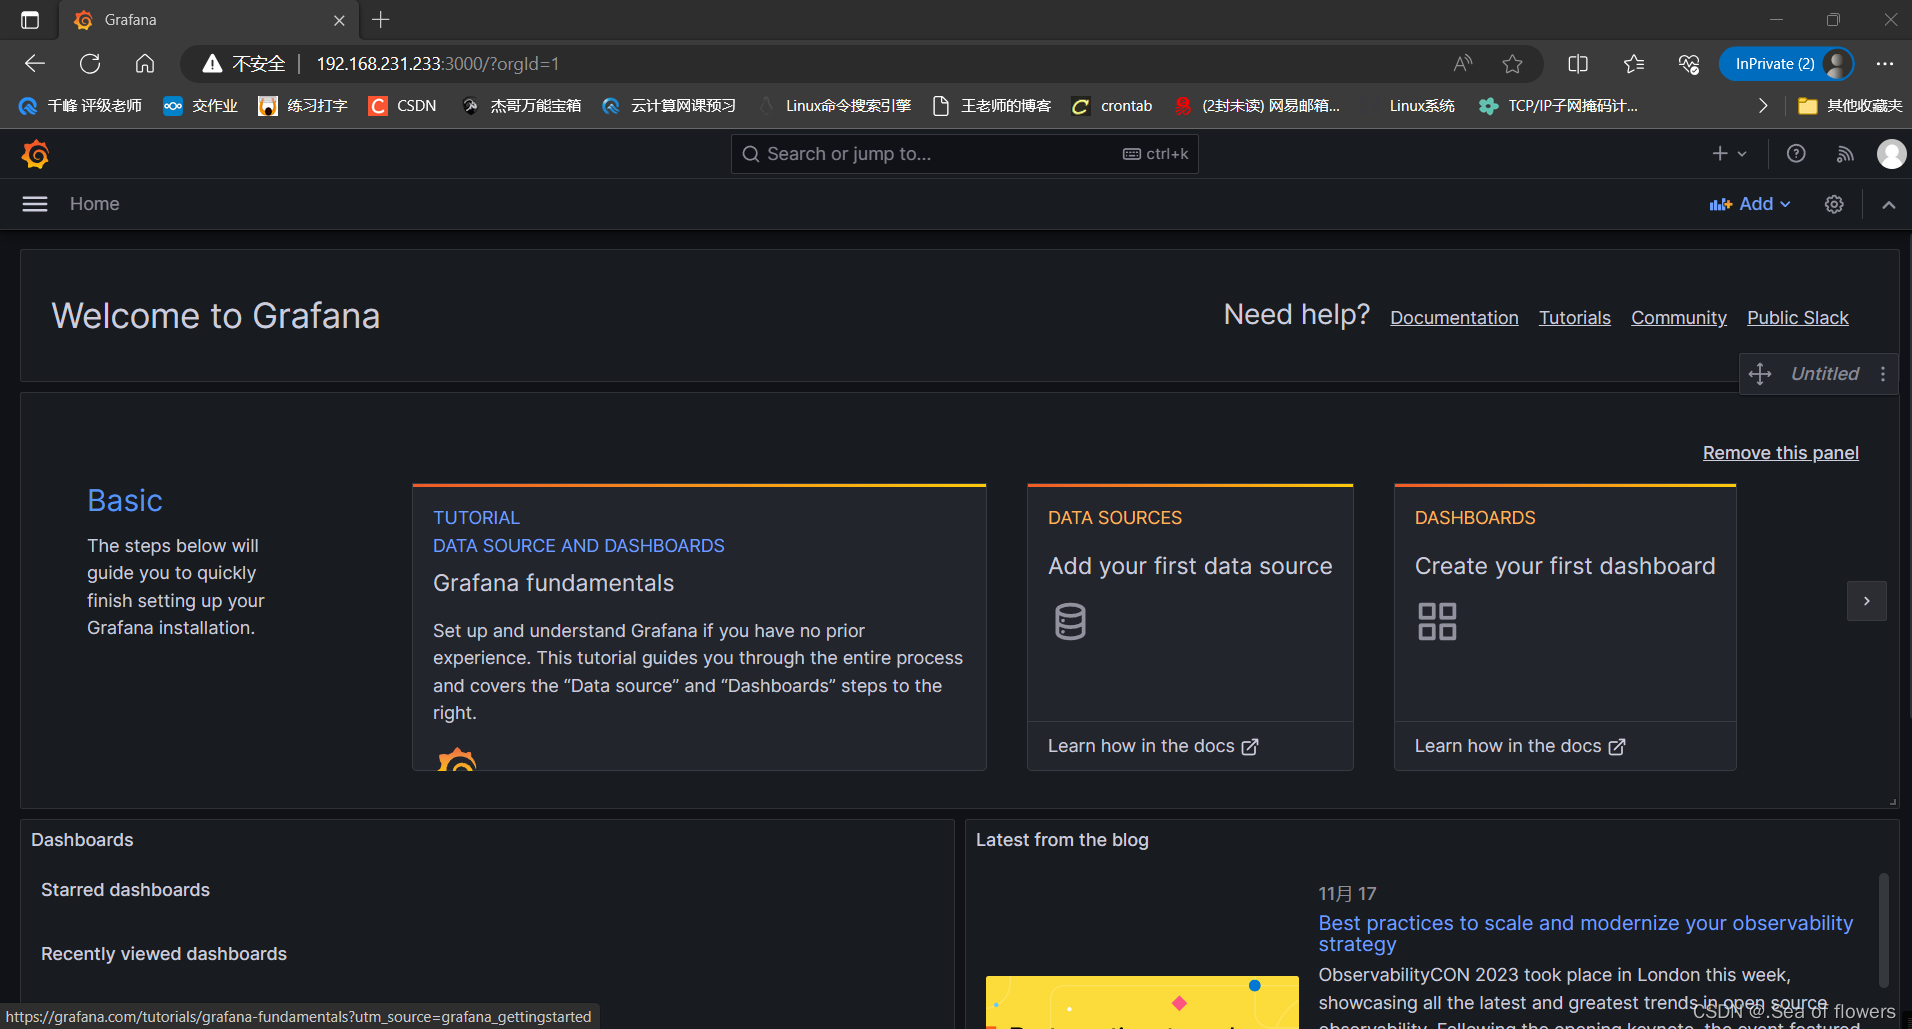
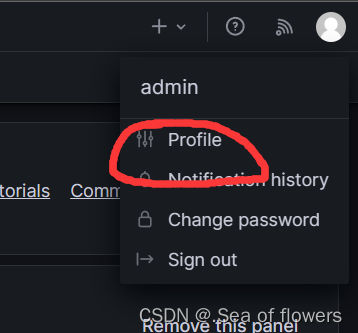
看不懂英文改中文
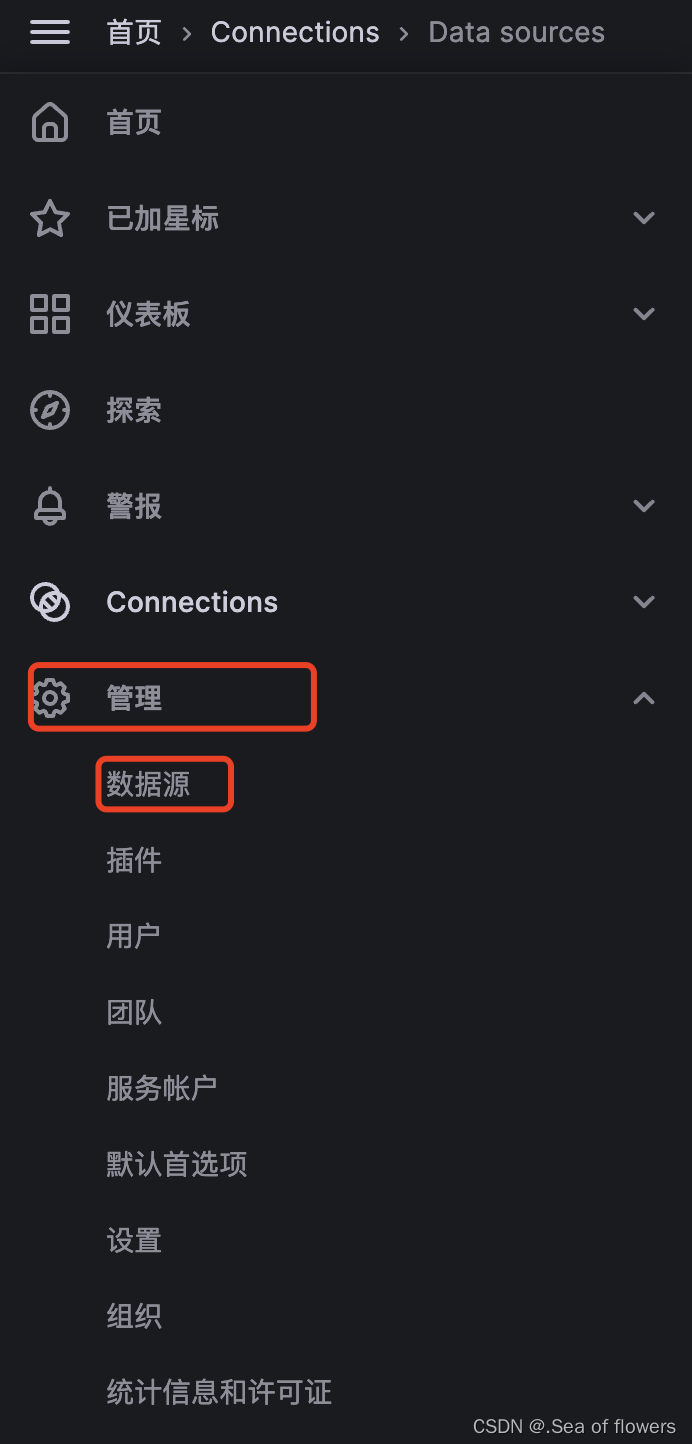
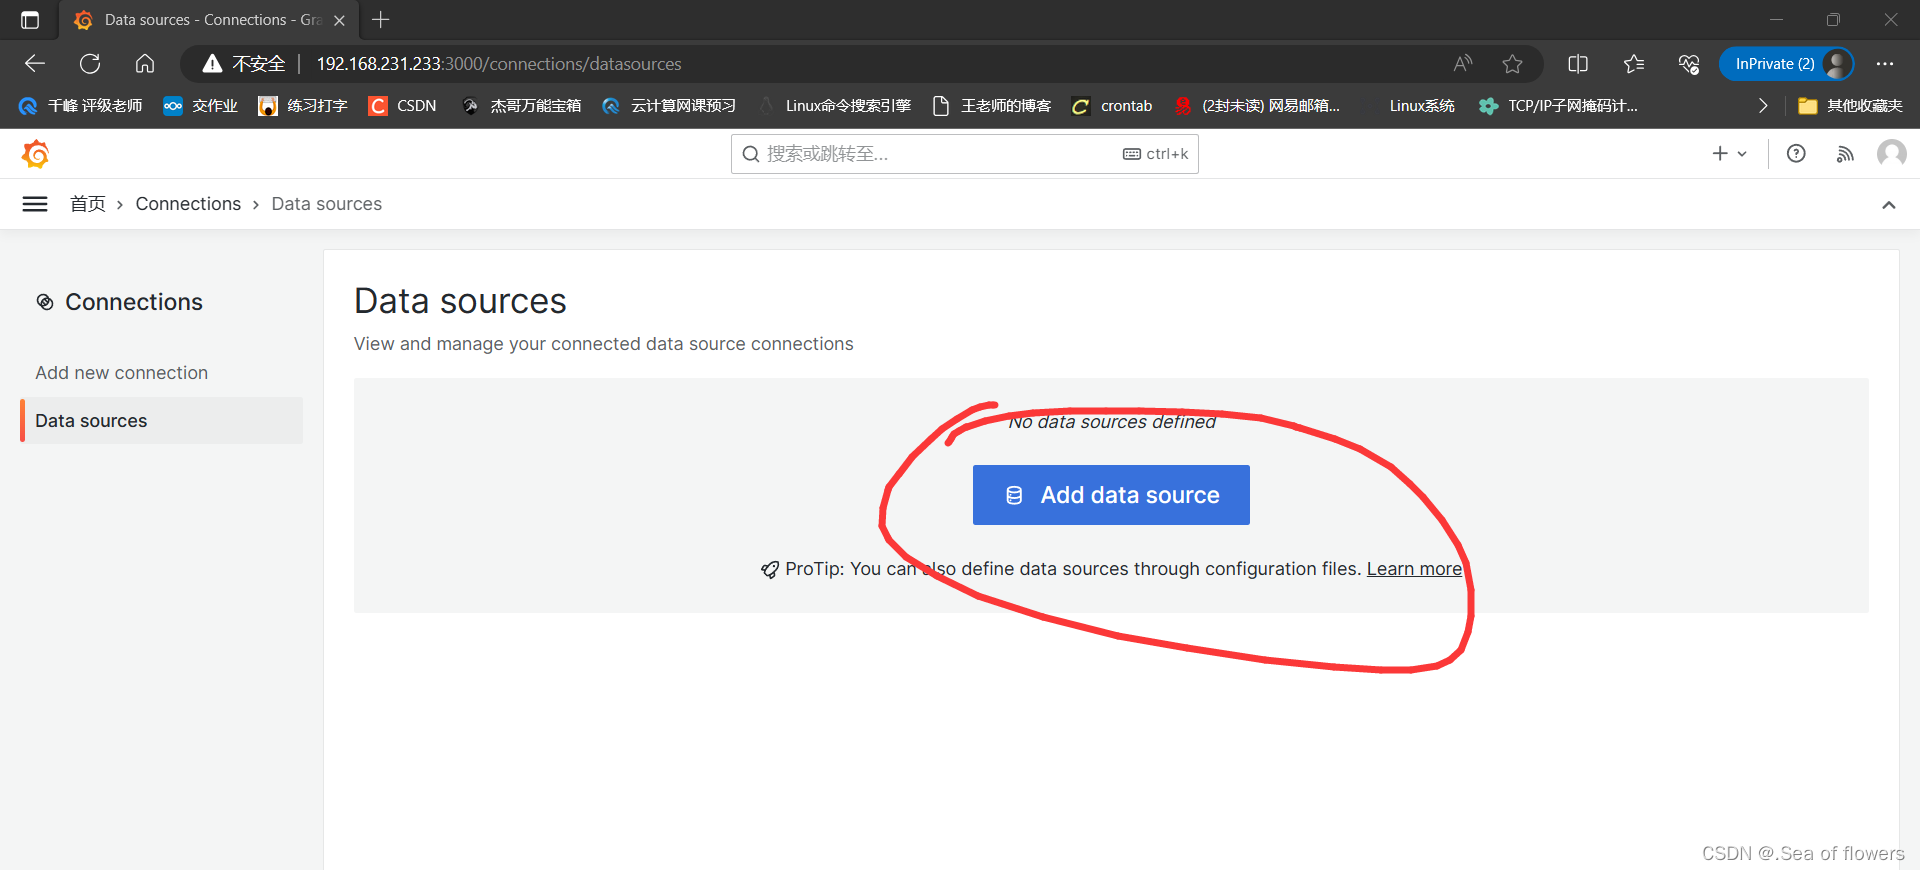
添加数据源


成功的提示

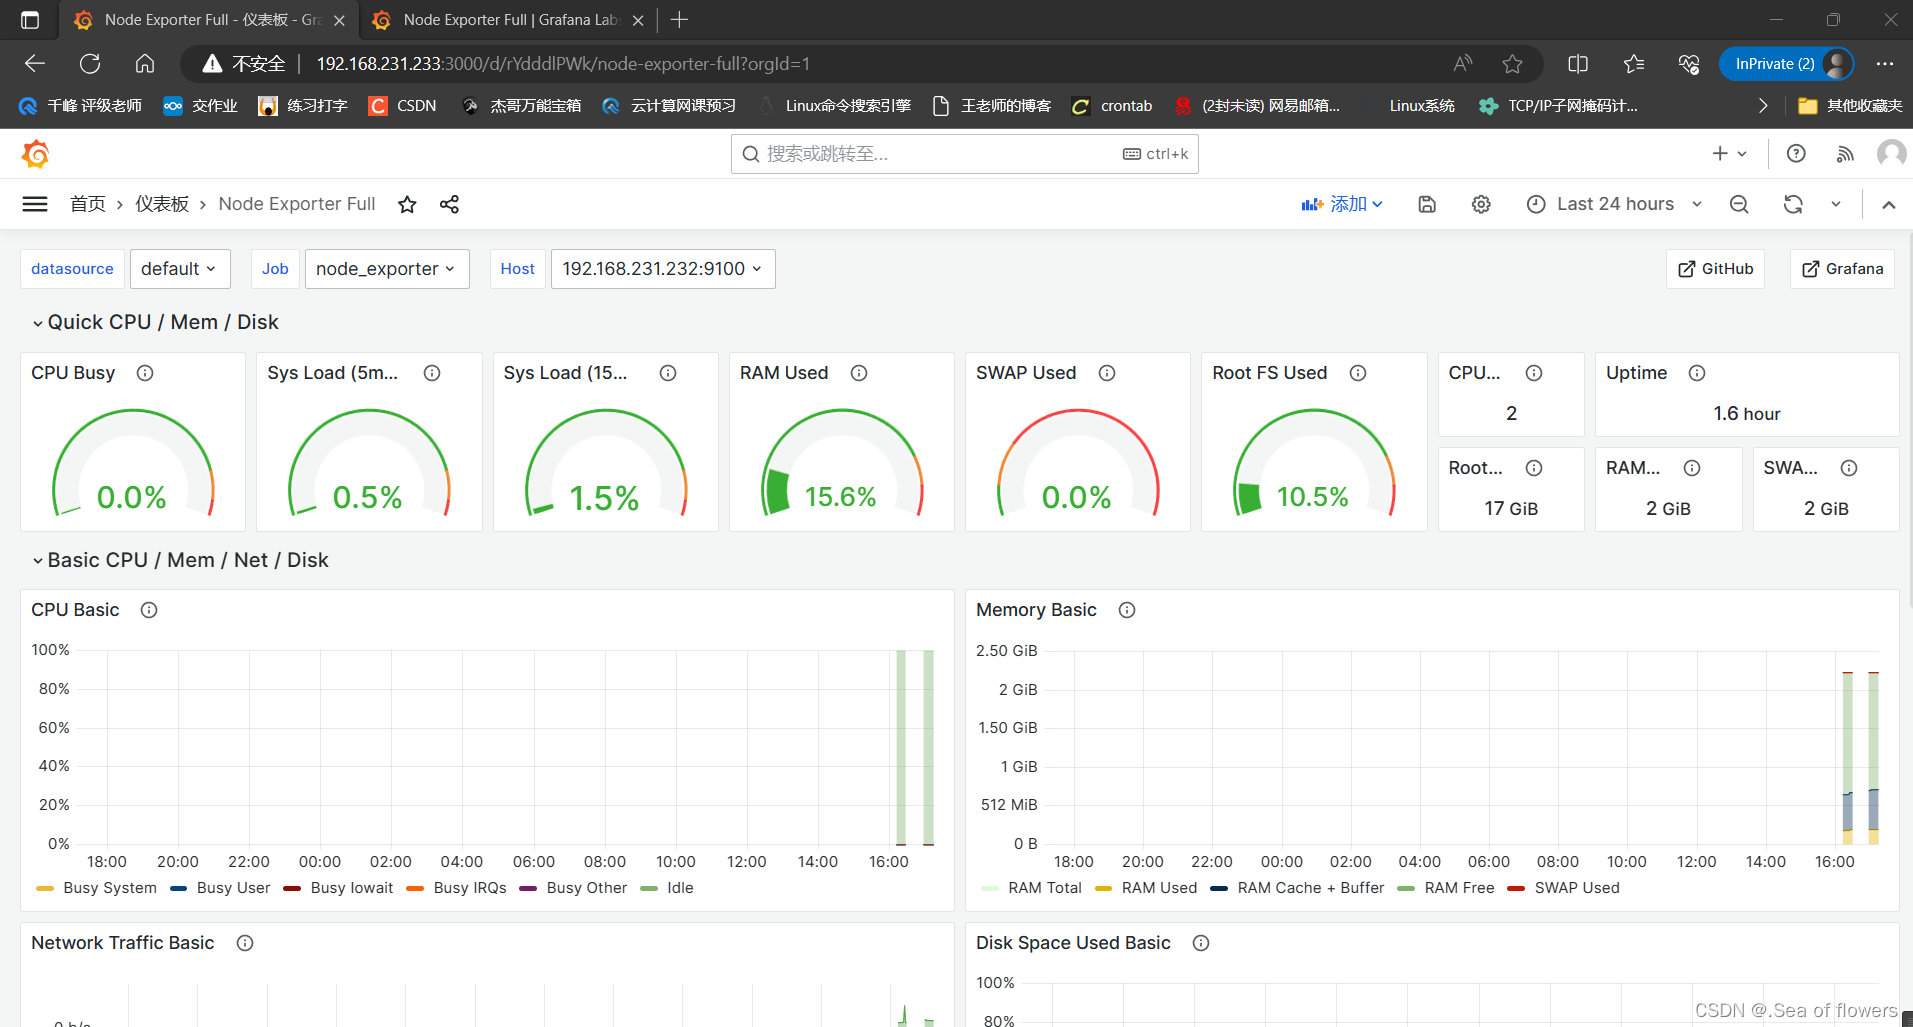
添加仪表盘
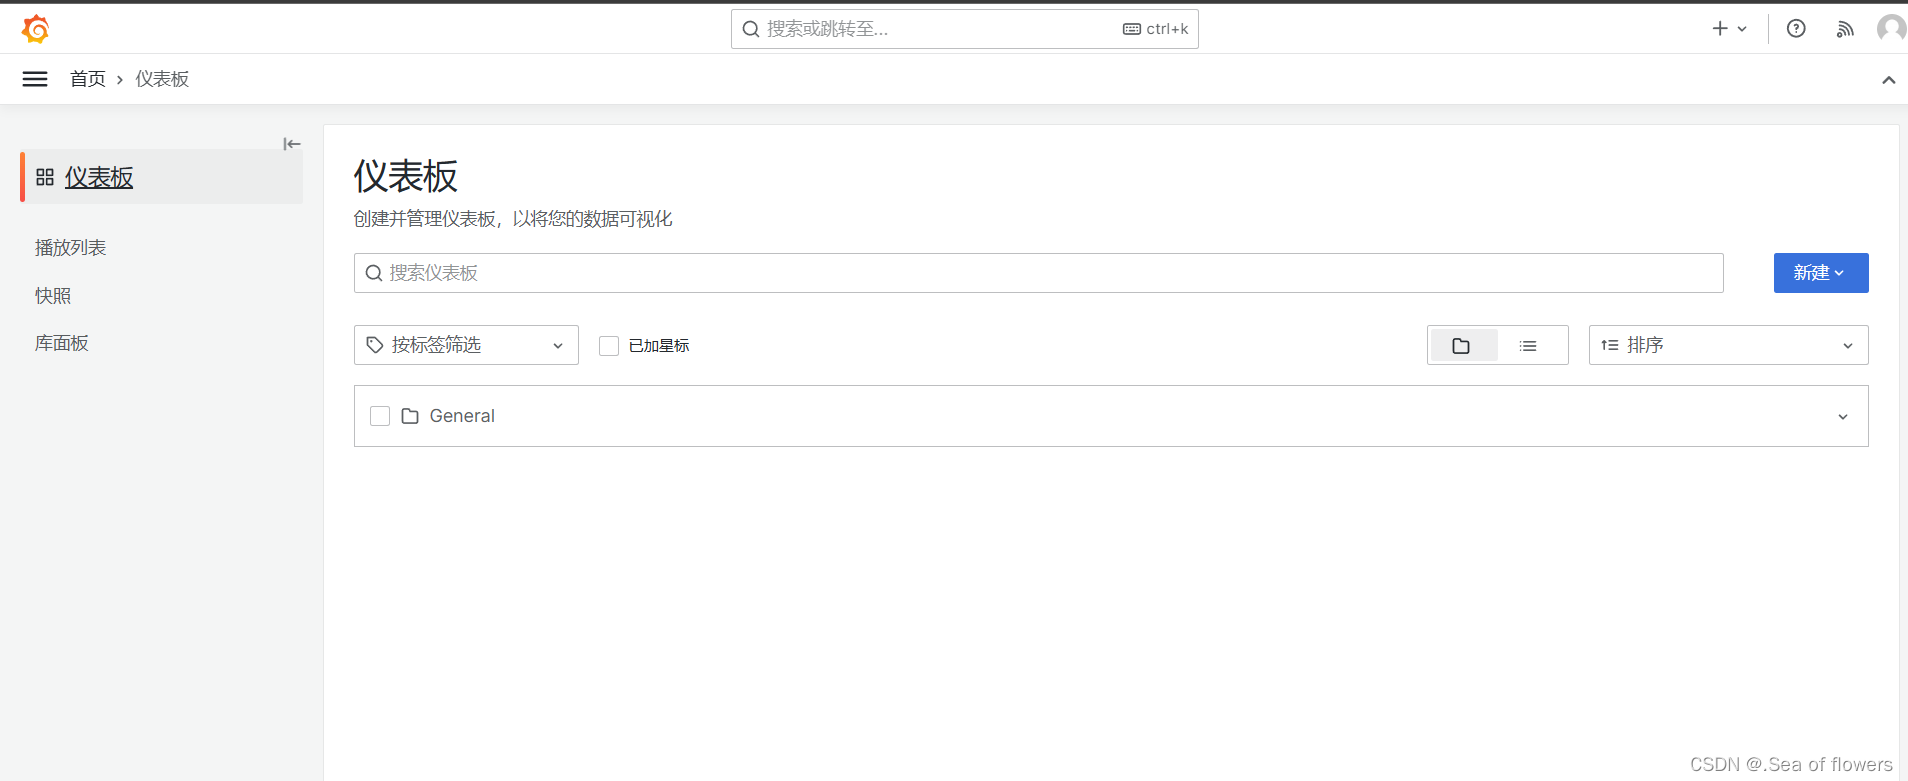
选择新建导入
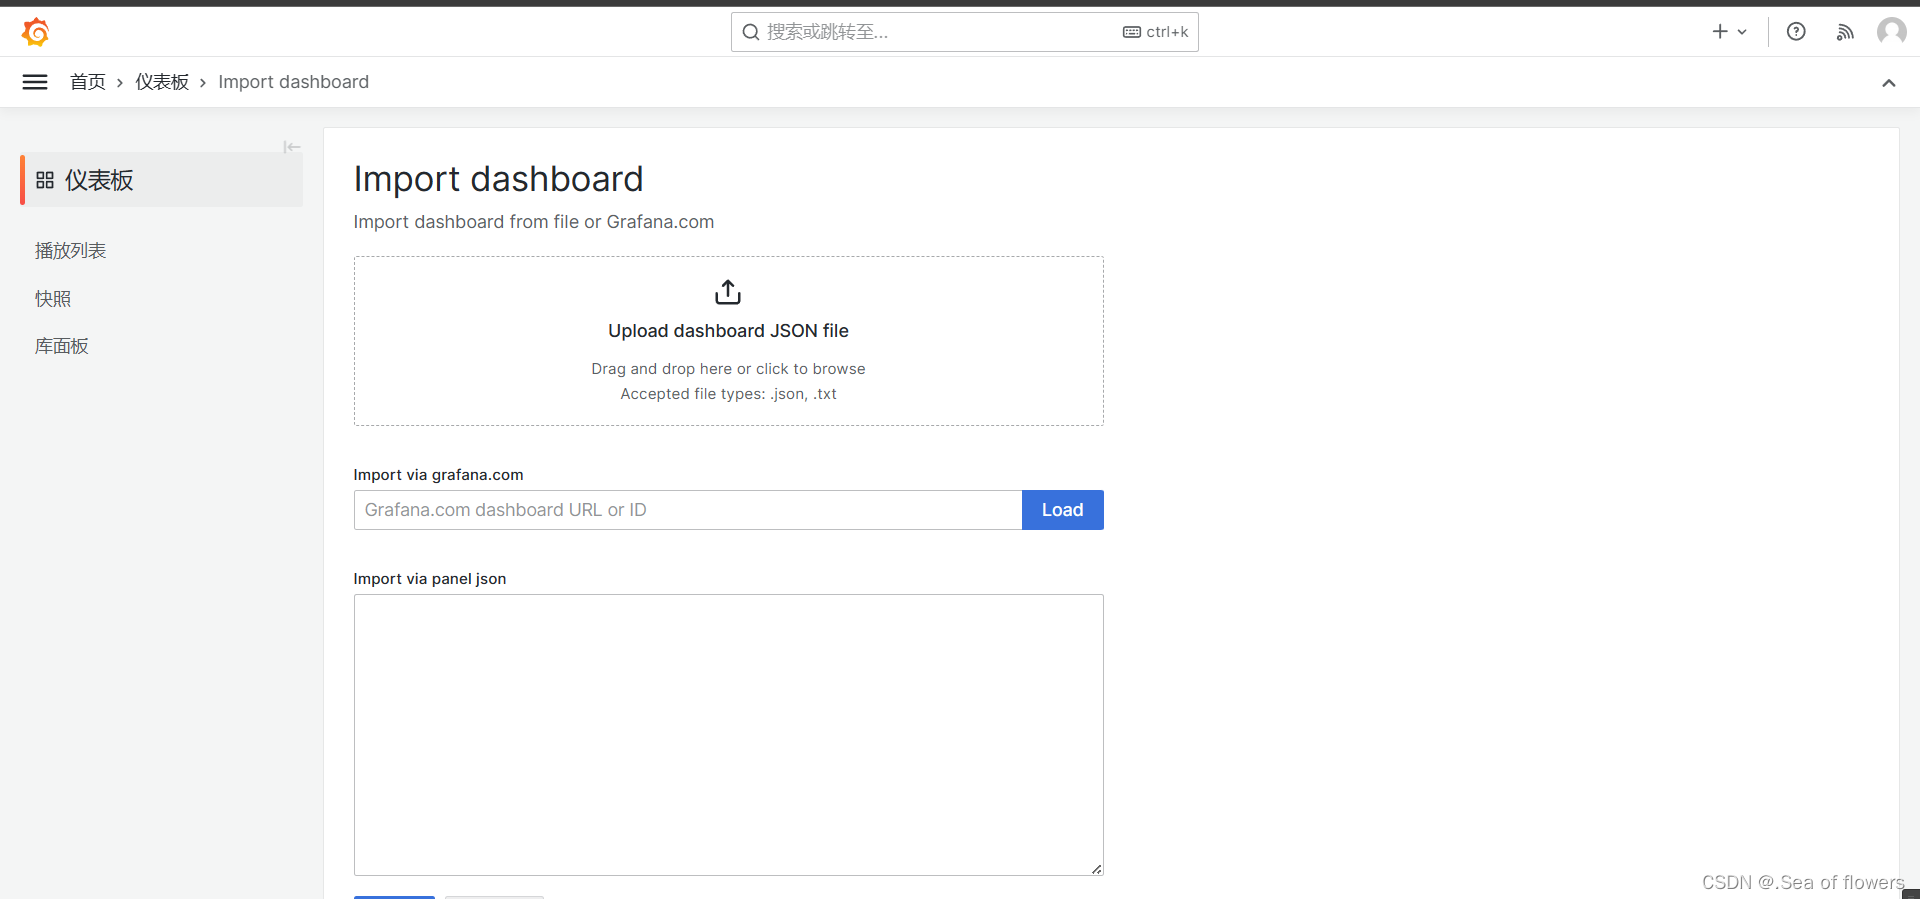
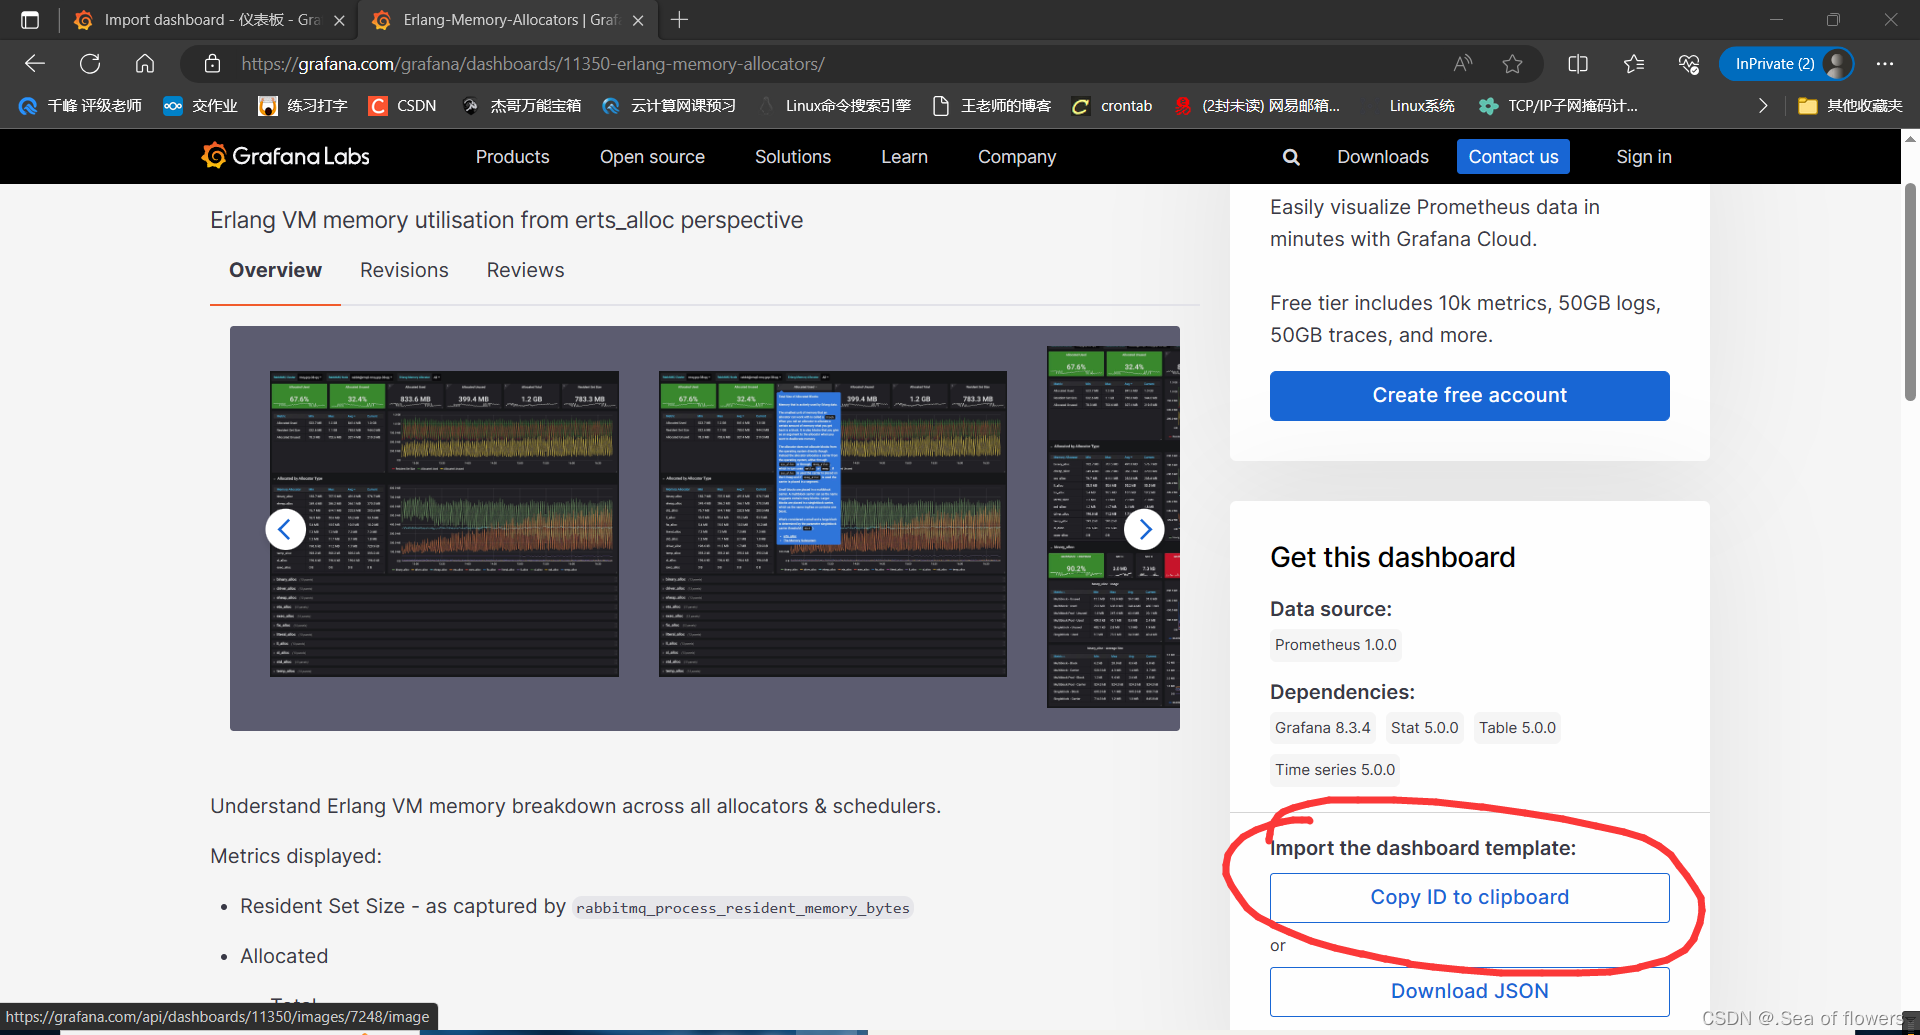
dashboards查找地址,去官方找模板
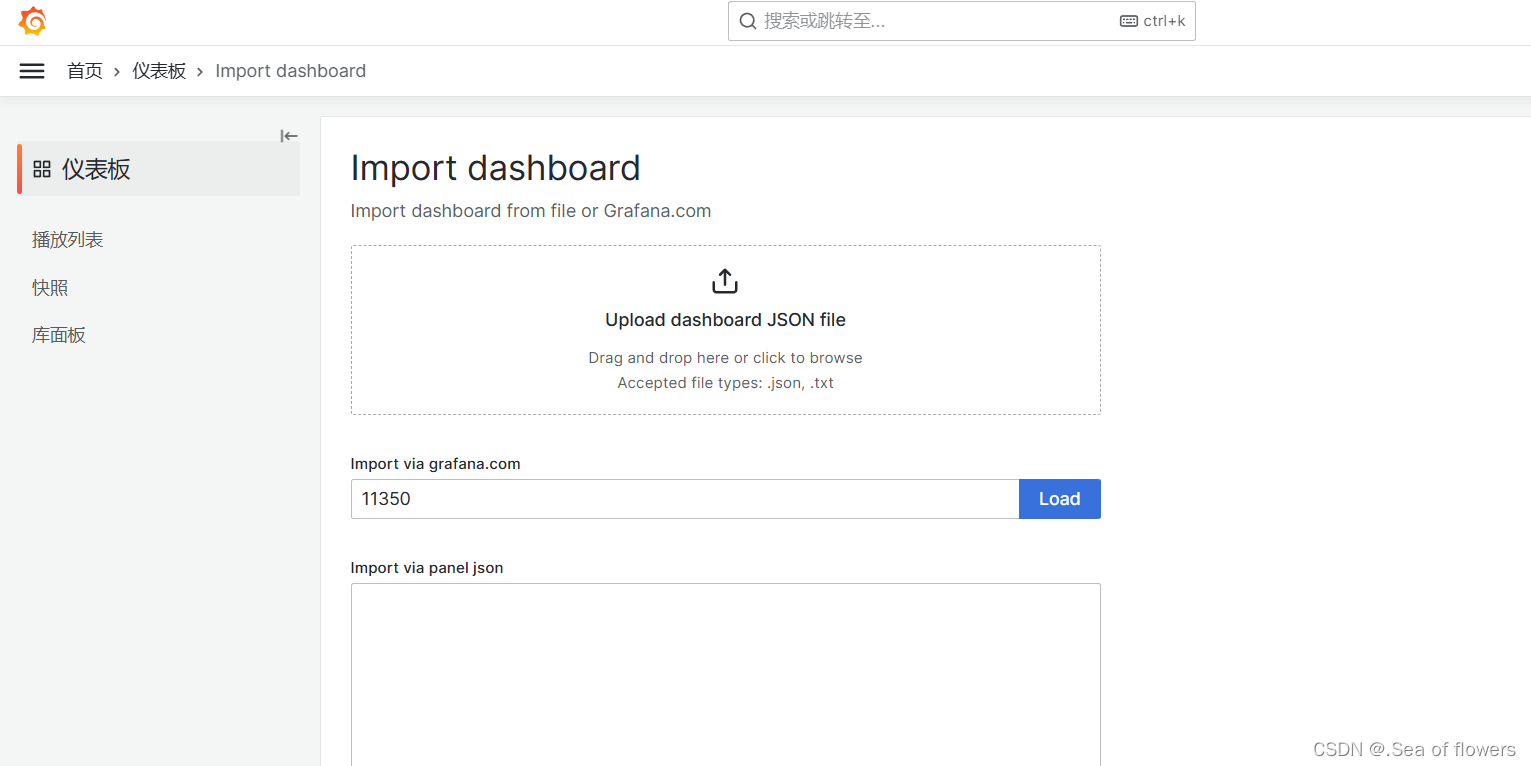
https://grafana.com/grafana/dashboards/
找到点击copy,会复制id
选择普罗米修斯
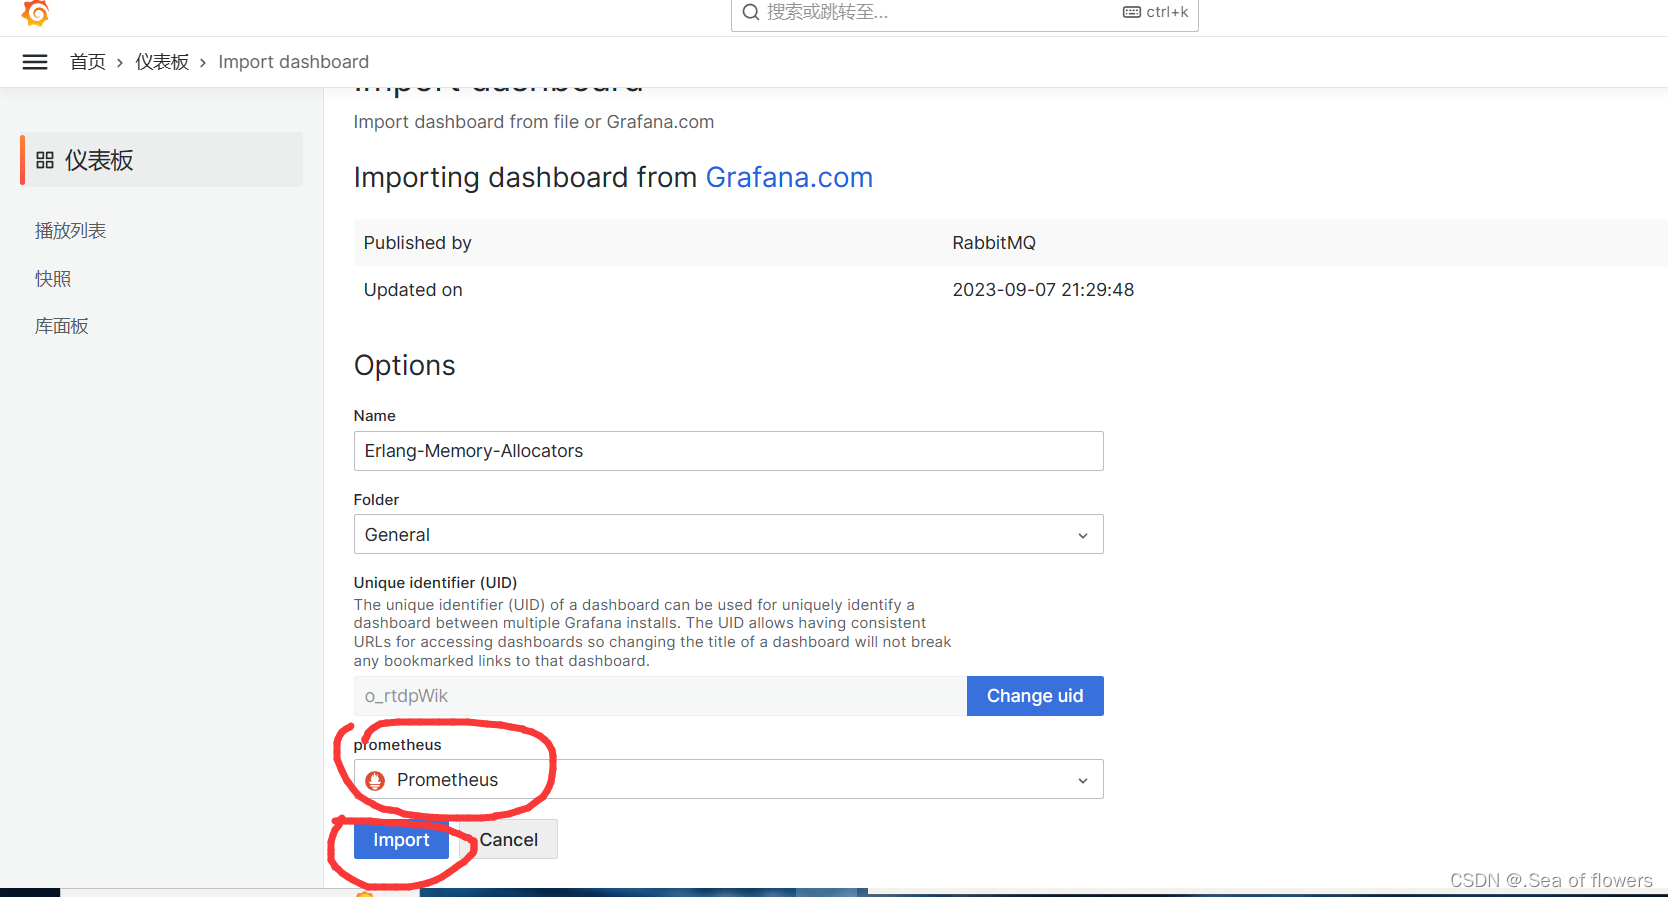
成功