03、K-means聚类实现步骤与基于K-means聚类的图像压缩(1)
03、K-means聚类实现步骤与基于K-means聚类的图像压缩(1)
03、K-means聚类实现步骤与基于K-means聚类的图像压缩(2)
开始学习机器学习啦,已经把吴恩达的课全部刷完了,现在开始熟悉一下复现代码。对这个手写数字实部比较感兴趣,作为入门的素材非常合适。
K-means聚类实现步骤
1、K-means基础
K-means算法是一种常用的聚类算法,它的实现步骤如下:
STEP1:从数据集中随机选择k个样本作为初始聚类中心。
STEP2:计算每个样本到各聚类中心的距离,并将样本归入最近的聚类中心。
STEP3:重新计算每个聚类的中心,该中心为该类所有样本的平均值。
STEP4:重复步骤2和3,直到满足以下条件之一:
聚类中心不再变化。
达到预设的最大迭代次数。
最小平方误差SSE(误差的平方和)达到预设的阈值。
2、K-means的底层代码实现
STEP0:调用numpy和绘图库:
import numpy as np
from matplotlib import pyplot as plt
STEP1:从数据集中随机选择k个样本作为初始聚类中心:
# 随机初始化聚类初始优化点
def kMeans_init_centroids(X, K):# 随机重新排序样本的索引randidx = np.random.permutation(X.shape[0])# 取前K个样本作为聚类中心centroids = X[randidx[:K]]return centroids
STEP2:计算每个样本到各聚类中心的距离,并将样本归入最近的聚类中心:
def find_closest_centroids(X, centroids):# 获取聚类中心的数量,也即K值K = centroids.shape[0]# 初始化一个数组用于存储每个样本所属的聚类中心的索引 idx = np.zeros(X.shape[0], dtype=int)# 遍历数据集中的每个样本for i in range(X.shape[0]):# 初始化一个列表用于存储当前样本到每个聚类中心的距离distance = []# 计算当前样本到每个聚类中心的距离for j in range(centroids.shape[0]):# 使用欧几里得距离公式计算样本i与聚类中心j之间的距离norm_ij = np.linalg.norm(X[i] - centroids[j])distance.append(norm_ij)# 找出距离列表中的最小值,该最小值对应的索引就是当前样本所属的聚类中心idx[i] = np.argmin(distance)# 返回每个样本所属的聚类中心的索引数组return idx
STEP3:重新计算每个聚类的中心,该中心为该类所有样本的平均值:
def compute_centroids(X, idx, K):# 获取数据集X的行数m和列数n # m表示样本数量,n表示每个样本的特征数量 m, n = X.shape# 初始化一个K x n的零矩阵,用于存储K个聚类中心 # K表示聚类数量,n表示特征数量 centroids = np.zeros((K, n))# 遍历每个聚类中心 for k in range(K):# 从数据集X中选择属于当前聚类k的所有样本 # idx是一个长度为m的数组,存储了每个样本所属的聚类中心的索引 points = X[idx == k]# 计算属于当前聚类k的所有样本的平均值,得到聚类中心 # axis=0表示按列计算平均值 centroids[k] = np.mean(points, axis=0)# 返回计算得到的K个聚类中心 return centroids
STEP4:重复步骤2和3,直到满足以下条件之一:
聚类中心不再变化。
达到预设的最大迭代次数。
最小平方误差SSE(误差的平方和)达到预设的阈值。
此处直接以达到预设的最大迭代次数作为停止条件
def run_kMeans(X, initial_centroids, max_iters=10):# 获取数据集X的行数m和列数n# m表示样本数量,n表示每个样本的特征数量m, n = X.shape# 获取初始聚类中心的数量KK = initial_centroids.shape[0]# 将初始聚类中心赋值给centroids变量centroids = initial_centroids# 将初始聚类中心复制给previous_centroids变量,用于后续比较聚类中心是否发生变化previous_centroids = centroids# 初始化一个长度为m的零数组,用于存储每个样本所属的聚类中心的索引idx = np.zeros(m)# 开始运行K-means算法,最多迭代max_iters次for i in range(max_iters):# 输出当前迭代进度print("K-Means iteration %d/%d" % (i, max_iters - 1))# 调用find_closest_centroids函数,为数据集X中的每个样本找到最近的聚类中心,并返回索引数组idx = find_closest_centroids(X, centroids)# 调用compute_centroids函数,根据每个样本所属的聚类中心和索引数组,计算新的聚类中心centroids = compute_centroids(X, idx, K)# 返回最终的聚类中心和每个样本所属的聚类中心的索引return centroids, idx
3、K-means的底层代码案例
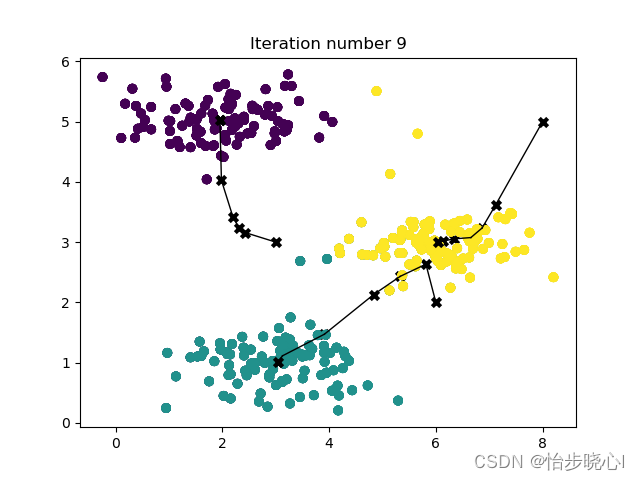
此处直接使用吴恩达的案例,非常简洁直观嘞:
import numpy as np
import matplotlib.pyplot as pltdef load_data():X = np.load("K_means_data/ex7_X.npy")return Xdef draw_line(p1, p2, style="-k", linewidth=1):plt.plot([p1[0], p2[0]], [p1[1], p2[1]], style, linewidth=linewidth)def plot_data_points(X, idx):# plots data points in X, coloring them so that those with the same# index assignments in idx have the same colorplt.scatter(X[:, 0], X[:, 1], c=idx)def plot_progress_kMeans(X, centroids, previous_centroids, idx, K, i):# Plot the examplesplot_data_points(X, idx)# Plot the centroids as black 'x'splt.scatter(centroids[:, 0], centroids[:, 1], marker='x', c='k', linewidths=3)# Plot history of the centroids with linesfor j in range(centroids.shape[0]):draw_line(centroids[j, :], previous_centroids[j, :])plt.title("Iteration number %d" % i)def find_closest_centroids(X, centroids):"""Computes the centroid memberships for every exampleArgs:X (ndarray): (m, n) Input valuescentroids (ndarray): k centroidsReturns:idx (array_like): (m,) closest centroids"""# Set KK = centroids.shape[0]# You need to return the following variables correctlyidx = np.zeros(X.shape[0], dtype=int)for i in range(X.shape[0]):# Array to hold distance between X[i] and each centroids[j]distance = []for j in range(centroids.shape[0]):norm_ij = np.linalg.norm(X[i] - centroids[j])distance.append(norm_ij)idx[i] = np.argmin(distance)return idx# GRADED FUNCTION: compute_centpods
def compute_centroids(X, idx, K):"""Returns the new centroids by computing the means of thedata points assigned to each centroid.Args:X (ndarray):   (m, n) Data pointsidx (ndarray): (m,) Array containing index of closest centroid for eachexample in X. Concretely, idx[i] contains the index ofthe centroid closest to example iK (int):       number of centroidsReturns:centroids (ndarray): (K, n) New centroids computed"""# Useful variablesm, n = X.shape# You need to return the following variables correctlycentroids = np.zeros((K, n))for k in range(K):points = X[idx == k]centroids[k] = centroids[k] = np.mean(points, axis=0)return centroids# You do not need to implement anything for this part
def run_kMeans(X, initial_centroids, max_iters=10, plot_progress=False):"""Runs the K-Means algorithm on data matrix X, where each row of Xis a single example"""# Initialize valuesm, n = X.shapeK = initial_centroids.shape[0]centroids = initial_centroidsprevious_centroids = centroidsidx = np.zeros(m)# Run K-Meansfor i in range(max_iters):# Output progressprint("K-Means iteration %d/%d" % (i, max_iters - 1))# For each example in X, assign it to the closest centroididx = find_closest_centroids(X, centroids)# Optionally plot progressif plot_progress:plot_progress_kMeans(X, centroids, previous_centroids, idx, K, i)previous_centroids = centroids# Given the memberships, compute new centroidscentroids = compute_centroids(X, idx, K)plt.show()return centroids, idx# Load an example dataset
X = load_data()
# Set initial centroids
initial_centroids = np.array([[3,3],[6,2],[8,5]])
K = 3
# Number of iterations
max_iters = 10
centroids, idx = run_kMeans(X, initial_centroids, max_iters, plot_progress=True)
运行结果:


