其他echarts:
echarts绘制一个环形图
echarts绘制一个饼图
echarts绘制一个环形图2
效果: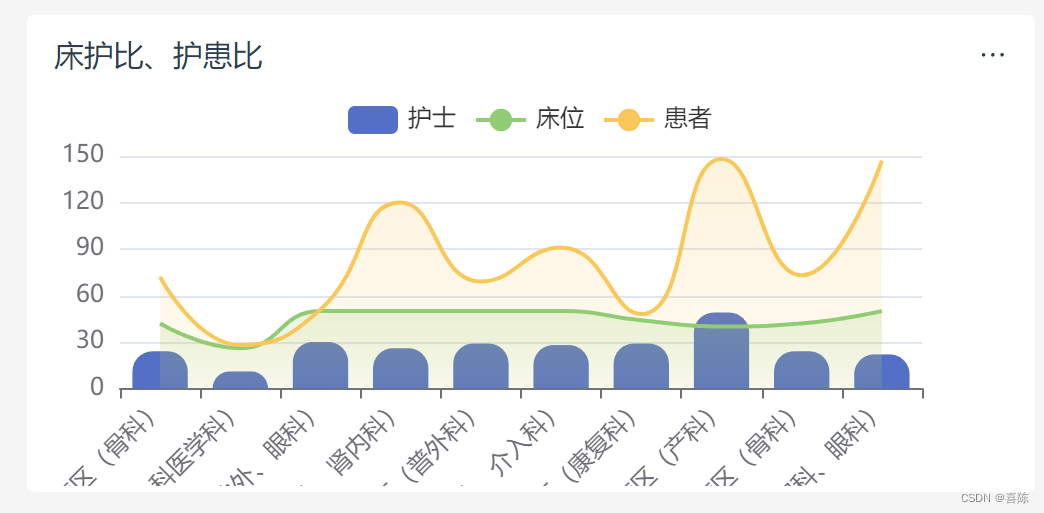
代码:
<template><div class="wrapper"><!-- 柱状图 --><div v-if="type == 'new_bar'" ref="barChart" id="barChart"></div><!-- 柱状图加折线图 --><div v-else ref="barChart2" id="barChart2"></div></div>
</template><script>
export default {mixins: [],components: {},props: {table: {type: Object,default: {datas: {},color: [],},},type: {type: String,default: "new_bar",},},data() {return {lineData: null,legendData: [], //一共有几个数据xAxis: {}, // X轴的显示yAxis: [], // Y轴的显示series: [],};},created() {},mounted() {},watch: {table: {handler(newVal) {if (newVal) {// 进行数据处理操作// console.log("柱状图", newVal);if (this.type == "new_barLine") {// 去重判断一共有几组数据this.legendData = this.$common.distinct(newVal.datas, "COL");this.legendData = this.legendData.map((item) => {return item.COL;});// 将所有数据根据col属性名相同的合并为一个新的对象this.lineData = this.$common.groupByProperty(newVal.datas, "COL");this.xAxis = [{type: "category",data: this.lineData[this.legendData[0]].map((item) => {return item.NAME;}),axisLabel: {rotate: 45, // 设置 x 轴名称逆时针旋转角度},axisPointer: {type: "shadow",},},];this.legendData.forEach((item, index) => {if (index > 0) {// 确定Y轴this.yAxis.push({type: "value",min: 0,// interval: 5,axisLabel: {formatter: "{value}",},});// 增加线this.series.push({name: item,type: "line",smooth: true, //线变得有弧度symbol: "none", //隐藏小圆点color: newVal.color[index],areaStyle: {//折线图下边阴影color: {type: "linear",x: 0,y: 0,x2: 0,y2: 1,colorStops: [{offset: 0,color: newVal.color[index] + "4C", // 渐变起始颜色},{offset: 1,color: newVal.color[index] + "19", // 渐变结束颜色},],},},tooltip: {valueFormatter: (value) => {return value + "";},},data: this.lineData[item].map((item, index) => {return item.VALUE || item.NUM ? item.VALUE || item.NUM : 0;}),});}});} else {this.xAxis = [{type: "category",data: this.table.datas.map((item, index) => {return item.NAME;}),axisLabel: {rotate: 45, // 设置 x 轴名称逆时针旋转角度},axisPointer: {type: "shadow",},},];this.yAxis.push({type: "value",min: 0,// interval: 5,axisLabel: {formatter: "{value}",},});}setTimeout(() => {this.init();});}},},},methods: {init() {let option = {tooltip: {trigger: "axis",axisPointer: {type: "cross",crossStyle: {color: "#999",},},formatter: (params) => {// 如果是单一的柱状图就从空开始加等于let result =params[0].name + (this.type == "new_bar" ? "" : ":<br>");for (let i = 0; i < params.length; i++) {let seriesName = params[i].seriesName; // 获取系列名称let value = params[i].value; // 获取当前数据的value// 根据系列名称进行判断,执行不同的逻辑result += seriesName + ": " + (value ? value : 0) + "<br>";}return result;},},grid: {top: "30",left: "40", // 调整y轴距离左侧的距离bottom: "25%",},toolbox: {feature: {// dataView: { show: true, readOnly: false },// magicType: { show: true, type: ["line", "bar"] },// restore: { show: true },// saveAsImage: { show: true },},},legend: {data: this.legendData,},xAxis: this.xAxis,yAxis: this.yAxis,series: [{name: this.lineData ? this.lineData[this.legendData[0]][0].COL : "",type: "bar",color: this.table.color[0],label: {show: false, // 显示标签position: "top", // 标签位置formatter: "{c}", // 标签内容格式化color: "black", // 标签颜色},tooltip: {valueFormatter: (value) => {return value + "";},},itemStyle: {borderRadius: [10, 10, 0, 0],// color: this.table.color[0],},data: this.table.datas.map((item, index) => {return item.VALUE || item.NUM ? item.VALUE || item.NUM : 0;}),},...this.series,// {//   name: "护士",//   type: "line",//   smooth: true, //线变得有弧度//   symbol: "none", //隐藏小圆点//   color: this.table.color[1],//   areaStyle: {//     //折线图下边阴影//     color: {//       type: "linear",//       x: 0,//       y: 0,//       x2: 0,//       y2: 1,//       colorStops: [//         {//           offset: 0,//           color: this.table.color[1] + "4C", // 渐变起始颜色//         },//         {//           offset: 1,//           color: this.table.color[1] + "19", // 渐变结束颜色//         },//       ],//     },//   },//   tooltip: {//     valueFormatter: function (value) {//       return value + "";//     },//   },//   data: [//     2.6, 5.9, 9.0, 26.4, 28.7, 70.7, 175.6, 182.2, 48.7, 18.8, 6.0,//     2.3,//   ],// },// {//   name: "患者",//   type: "line",//   smooth: true, //线变得有弧度//   symbol: "none", //隐藏小圆点//   color: this.table.color[2],//   areaStyle: {//     //折线图下边阴影//     color: {//       type: "linear",//       x: 0,//       y: 0,//       x2: 0,//       y2: 1,//       colorStops: [//         {//           offset: 0,//           color: this.table.color[2] + "4C", // 渐变起始颜色//         },//         {//           offset: 1,//           color: this.table.color[2] + "19", // 渐变结束颜色//         },//       ],//     },//   },//   tooltip: {//     valueFormatter: function (value) {//       return value + " °C";//     },//   },//   data: [//     2.0, 2.2, 3.3, 4.5, 6.3, 10.2, 20.3, 23.4, 23.0, 16.5, 12.0, 6.2,//   ],// },],};let chartDom =this.$refs[this.type == "new_bar" ? "barChart" : "barChart2"];let myChart = this.$E.init(chartDom);myChart.setOption(option);myChart.on("click", function (params) {console.log(params.seriesIndex);if (params.componentType === "series") {var dataIndex = params.dataIndex; // 获取点击的数据索引var data = option.series[params.seriesIndex].data[dataIndex]; // 获取点击的数据对象console.log(data);}});},},
};
</script>
<style scoped lang="scss">
.wrapper {width: 100%;height: 100%;position: relative;#barChart,#barChart2 {width: 100%;height: 100%;}
}
</style>
调用:
<NewBarChart:table="table":style="{ height: heightNew }":type="style[0]"
/>
// heightNew : 动态计算的高度
// new_bar : new_bar / new_barLine
// table:
/*** {"color": ["#5470c6","#91cc75","#fac858","#ee6666","#73c0de","#3ba272","#fc8452","#9a60b4","#ea7ccc","#8364FF","#36F4D7","#FBB03C"],"datas": [{"COL": "护士","PXXH": 2,"NAME": "47病区(骨科)","VALUE": 24},{"COL": "护士","PXXH": 2,"NAME": "59病区(全科医学科)","VALUE": 11},{"COL": "护士","PXXH": 2,"NAME": "45病区(神外、眼科)","VALUE": 30},{"COL": "护士","PXXH": 2,"NAME": "40病区(泌尿外、肾内科)","VALUE": 26},{"COL": "护士","PXXH": 2,"NAME": "38病区(普外科)","VALUE": 29},{"COL": "护士","PXXH": 2,"NAME": "46病区(心胸外、介入科)","VALUE": 28},{"COL": "护士","PXXH": 2,"NAME": "52病区(康复科)","VALUE": 29},{"COL": "护士","PXXH": 2,"NAME": "31病区(产科)","VALUE": 49},{"COL": "护士","PXXH": 2,"NAME": "37病区(骨科)","VALUE": 24},{"COL": "护士","PXXH": 2,"NAME": "35病区(妇科、眼科)","VALUE": 22},{"COL": "床位","PXXH": 1,"NAME": "47病区(骨科)","VALUE": 42},{"COL": "床位","PXXH": 1,"NAME": "59病区(全科医学科)","VALUE": 26},{"COL": "床位","PXXH": 1,"NAME": "45病区(神外、眼科)","VALUE": 50},{"COL": "床位","PXXH": 1,"NAME": "40病区(泌尿外、肾内科)","VALUE": 50},{"COL": "床位","PXXH": 1,"NAME": "46病区(心胸外、介入科)","VALUE": 50},{"COL": "床位","PXXH": 1,"NAME": "38病区(普外科)","VALUE": 50},{"COL": "床位","PXXH": 1,"NAME": "52病区(康复科)","VALUE": 44},{"COL": "床位","PXXH": 1,"NAME": "31病区(产科)","VALUE": 40},{"COL": "床位","PXXH": 1,"NAME": "37病区(骨科)","VALUE": 42},{"COL": "床位","PXXH": 1,"NAME": "35病区(妇科、眼科)","VALUE": 50},{"COL": "患者","PXXH": 3,"NAME": "47病区(骨科)","VALUE": 72},{"COL": "患者","PXXH": 3,"NAME": "59病区(全科医学科)","VALUE": 28},{"COL": "患者","PXXH": 3,"NAME": "45病区(神外、眼科)","VALUE": 51},{"COL": "患者","PXXH": 3,"NAME": "40病区(泌尿外、肾内科)","VALUE": 120},{"COL": "患者","PXXH": 3,"NAME": "46病区(心胸外、介入科)","VALUE": 69},{"COL": "患者","PXXH": 3,"NAME": "38病区(普外科)","VALUE": 91},{"COL": "患者","PXXH": 3,"NAME": "52病区(康复科)","VALUE": 48},{"COL": "患者","PXXH": 3,"NAME": "31病区(产科)","VALUE": 148},{"COL": "患者","PXXH": 3,"NAME": "37病区(骨科)","VALUE": 73},{"COL": "患者","PXXH": 3,"NAME": "35病区(妇科、眼科)","VALUE": 147}]
}*/