改进前的BarChart
如下是若依(Ruoyi)框架中的BarChart.vue文件,该BarChart.vue无法实现组件间的值传递。到这里您不妨可以试试该如何去传值。如果您不想思考,请看改进后的BarChart。直接拿走使用!
<template><div :class="className" :style="{height:height,width:width}" />
</template><script>
import * as echarts from 'echarts'
require('echarts/theme/macarons') // echarts theme
import resize from './mixins/resize'const animationDuration = 6000export default {mixins: [resize],props: {className: {type: String,default: 'chart'},width: {type: String,default: '100%'},height: {type: String,default: '300px'}},data() {return {chart: null}},mounted() {this.$nextTick(() => {this.initChart()})},beforeDestroy() {if (!this.chart) {return}this.chart.dispose()this.chart = null},methods: {initChart() {this.chart = echarts.init(this.$el, 'macarons')this.chart.setOption({tooltip: {trigger: 'axis',axisPointer: { // 坐标轴指示器,坐标轴触发有效type: 'shadow' // 默认为直线,可选为:'line' | 'shadow'}},grid: {top: 10,left: '2%',right: '2%',bottom: '3%',containLabel: true},xAxis: [{type: 'category',data: ['Mon', 'Tue', 'Wed', 'Thu', 'Fri', 'Sat', 'Sun'],axisTick: {alignWithLabel: true}}],yAxis: [{type: 'value',axisTick: {show: false}}],series: [{name: 'pageA',type: 'bar',stack: 'vistors',barWidth: '60%',data: [79, 52, 200, 334, 390, 330, 220],animationDuration}, {name: 'pageB',type: 'bar',stack: 'vistors',barWidth: '60%',data: [80, 52, 200, 334, 390, 330, 220],animationDuration}, {name: 'pageC',type: 'bar',stack: 'vistors',barWidth: '60%',data: [30, 52, 200, 334, 390, 330, 220],animationDuration}]})}}
}
</script>
改进后的BarChart
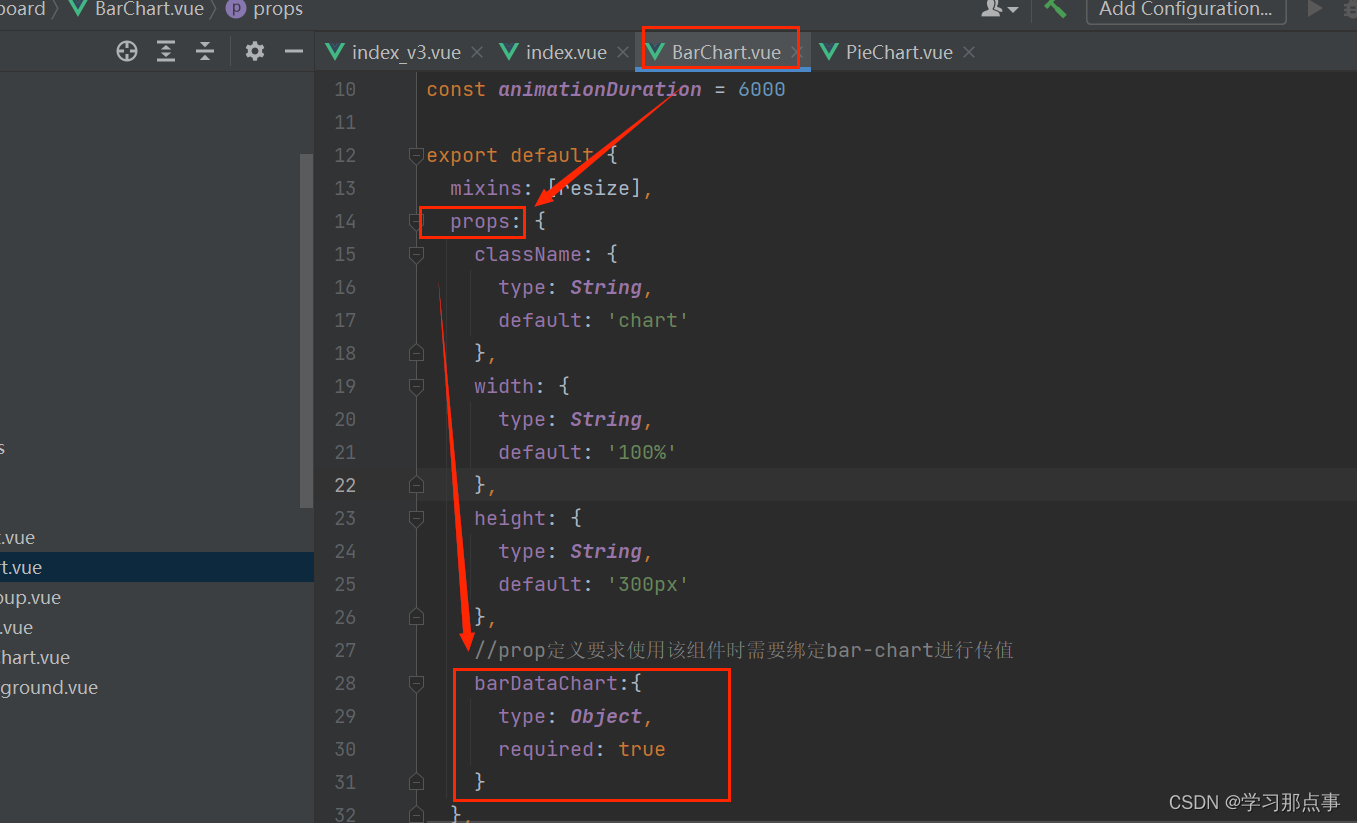
如下是根据若依框架改写后的BarChart.vue文件,该BarChart.vue可实现组件间的值传递。
<template><div :class="className" :style="{height:height,width:width}" />
</template><script>
import * as echarts from 'echarts';
require('echarts/theme/macarons') // echarts theme
import resize from './mixins/resize'const animationDuration = 6000export default {mixins: [resize],props: {className: {type: String,default: 'chart'},width: {type: String,default: '100%'},height: {type: String,default: '300px'},//prop定义要求使用该组件时需要绑定bar-chart进行传值barDataChart:{type: Object,required: true}},data() {return {chart: null}},//监听barChart中值的变化watch:{barDataChart:{deep:true,handler(val){this.setOptions(val)}}},mounted() {this.$nextTick(() => {this.initChart()})},beforeDestroy() {if (!this.chart) {return}this.chart.dispose()this.chart = null},methods: {initChart() {this.chart = echarts.init(this.$el, 'macarons')this.setOptions(this.barDataChart)},setOptions({work_days, hj_main_count, hj_right_count, hj_left_count, hj_main, hj_right, hj_left}) {this.chart.setOption({tooltip: {trigger: 'axis',axisPointer: { // 坐标轴指示器,坐标轴触发有效type: 'shadow' // 默认为直线,可选为:'line' | 'shadow'}},grid: {top: 10,left: '2%',right: '2%',bottom: '3%',containLabel: true},xAxis: [{type: 'category',data: work_days,// name:'日期',nameLocation: 'middle', // 显示位置nameTextStyle: {fontWeight: 'bold' // 字体加粗},axisTick: {alignWithLabel: true}}],yAxis: [{type: 'value',axisTick: {show: false},// name: '预警次数', // 添加单位// nameLocation: 'end', // 显示位置// nameTextStyle: {//    fontWeight: 'bold' // 字体加粗//   }axisLabel: {formatter: '{value} 次'}}],series: [{name: hj_main,type: 'bar',stack: 'vistors',barWidth: '60%',data: hj_main_count,animationDuration}, {name: hj_right,type: 'bar',stack: 'vistors',barWidth: '60%',data: hj_right_count,animationDuration}, {name: hj_left,type: 'bar',stack: 'vistors',barWidth: '60%',data: hj_left_count,animationDuration}]})}}
}
</script>
其他页面使用BarChart
如下以在ruoyi-ui/index.vue下使用BarChart文件为例进行介绍。
1.导入BarChart组件
<script>import BarChart from './dashboard/BarChart'
<script>
2.注册组件
export default {name: 'Index',components: {BarChart}
}
3.在所需位置引入
<div class="chart-wrapper"><bar-chart :bar-data-chart="barFalseChart"/></div>4.使用:bar-data-chart绑定需要展示的值,barFalseChart就是处理好等待渲染的对象
//柱状图数据
const barFalseChart = {work_days: ['周一', '周二', '周三', '周四', '周五', '周六', '周日'],hj_main_count: [9, 2, 0, 8, 0, 5, 1],hj_right_count: [8, 5, 3, 3, 9, 6, 4],hj_left_count: [3, 7, 1, 0, 3, 6, 4],hj_main: '圆棒浇铸区主摄像头预警次数',hj_left: '圆棒浇铸区左摄像头预警次数',hj_right: '圆棒浇铸区右摄像头预警次数'
}
其中barFalseChart为啥是对象,原因在这:
5.在data中也要绑定一下:
  data() {return {//柱状图数据barFalseChart:barFalseChart,}
}
6.最后一步,根据需求修改只要需要的值,文中需要修改和自定义的地方已经用注释标注出来了,各位看官按需进行修改。
(1)父组件中的定义:
//柱状图数据
const barFalseChart = {work_days: ['周一', '周二', '周三', '周四', '周五', '周六', '周日'],hj_main_count: [9, 2, 0, 8, 0, 5, 1],hj_right_count: [8, 5, 3, 3, 9, 6, 4],hj_left_count: [3, 7, 1, 0, 3, 6, 4],hj_main: '主摄像头预警次数',hj_left: '左摄像头预警次数',hj_right: '右摄像头预警次数'
}
(2)上手修改:
methods: {initChart() {this.chart = echarts.init(this.$el, 'macarons')this.setOptions(this.barDataChart)},
//  按需修改传入值,按需在setOptions({work_days, hj_main_count, hj_right_count, hj_left_count, hj_main, hj_right, hj_left})中进行自定义(但这些值是来自于父组件定义的值)setOptions({work_days, hj_main_count, hj_right_count, hj_left_count, hj_main, hj_right, hj_left}) {this.chart.setOption({tooltip: {trigger: 'axis',axisPointer: { type: 'shadow' }},grid: {top: 10,left: '2%',right: '2%',bottom: '3%',containLabel: true},xAxis: [{type: 'category',data: work_days,   //这里修改x轴的值axisTick: {alignWithLabel: true}}],yAxis: [{type: 'value',axisTick: {show: false},axisLabel: {formatter: '{value} 次'   //给y轴加上单位}}],series: [{name: hj_main,    //修改序列1的名称type: 'bar',stack: 'vistors',barWidth: '60%',data: hj_main_count, //修改序列1绑定的值animationDuration}, {name: hj_right,     //修改序列2的名称type: 'bar',stack: 'vistors',barWidth: '60%',data: hj_right_count,  //修改序列2绑定的值animationDuration}, {name: hj_left,   //修改序列3的名称type: 'bar',stack: 'vistors',barWidth: '60%',data: hj_left_count,  //修改序列3绑定的值animationDuration}]})}}
}
</script>


![Flink Kafka[输入/输出] Connector](https://img-blog.csdnimg.cn/direct/8a54a4ce359b4291b6acbf895ff3881e.png)