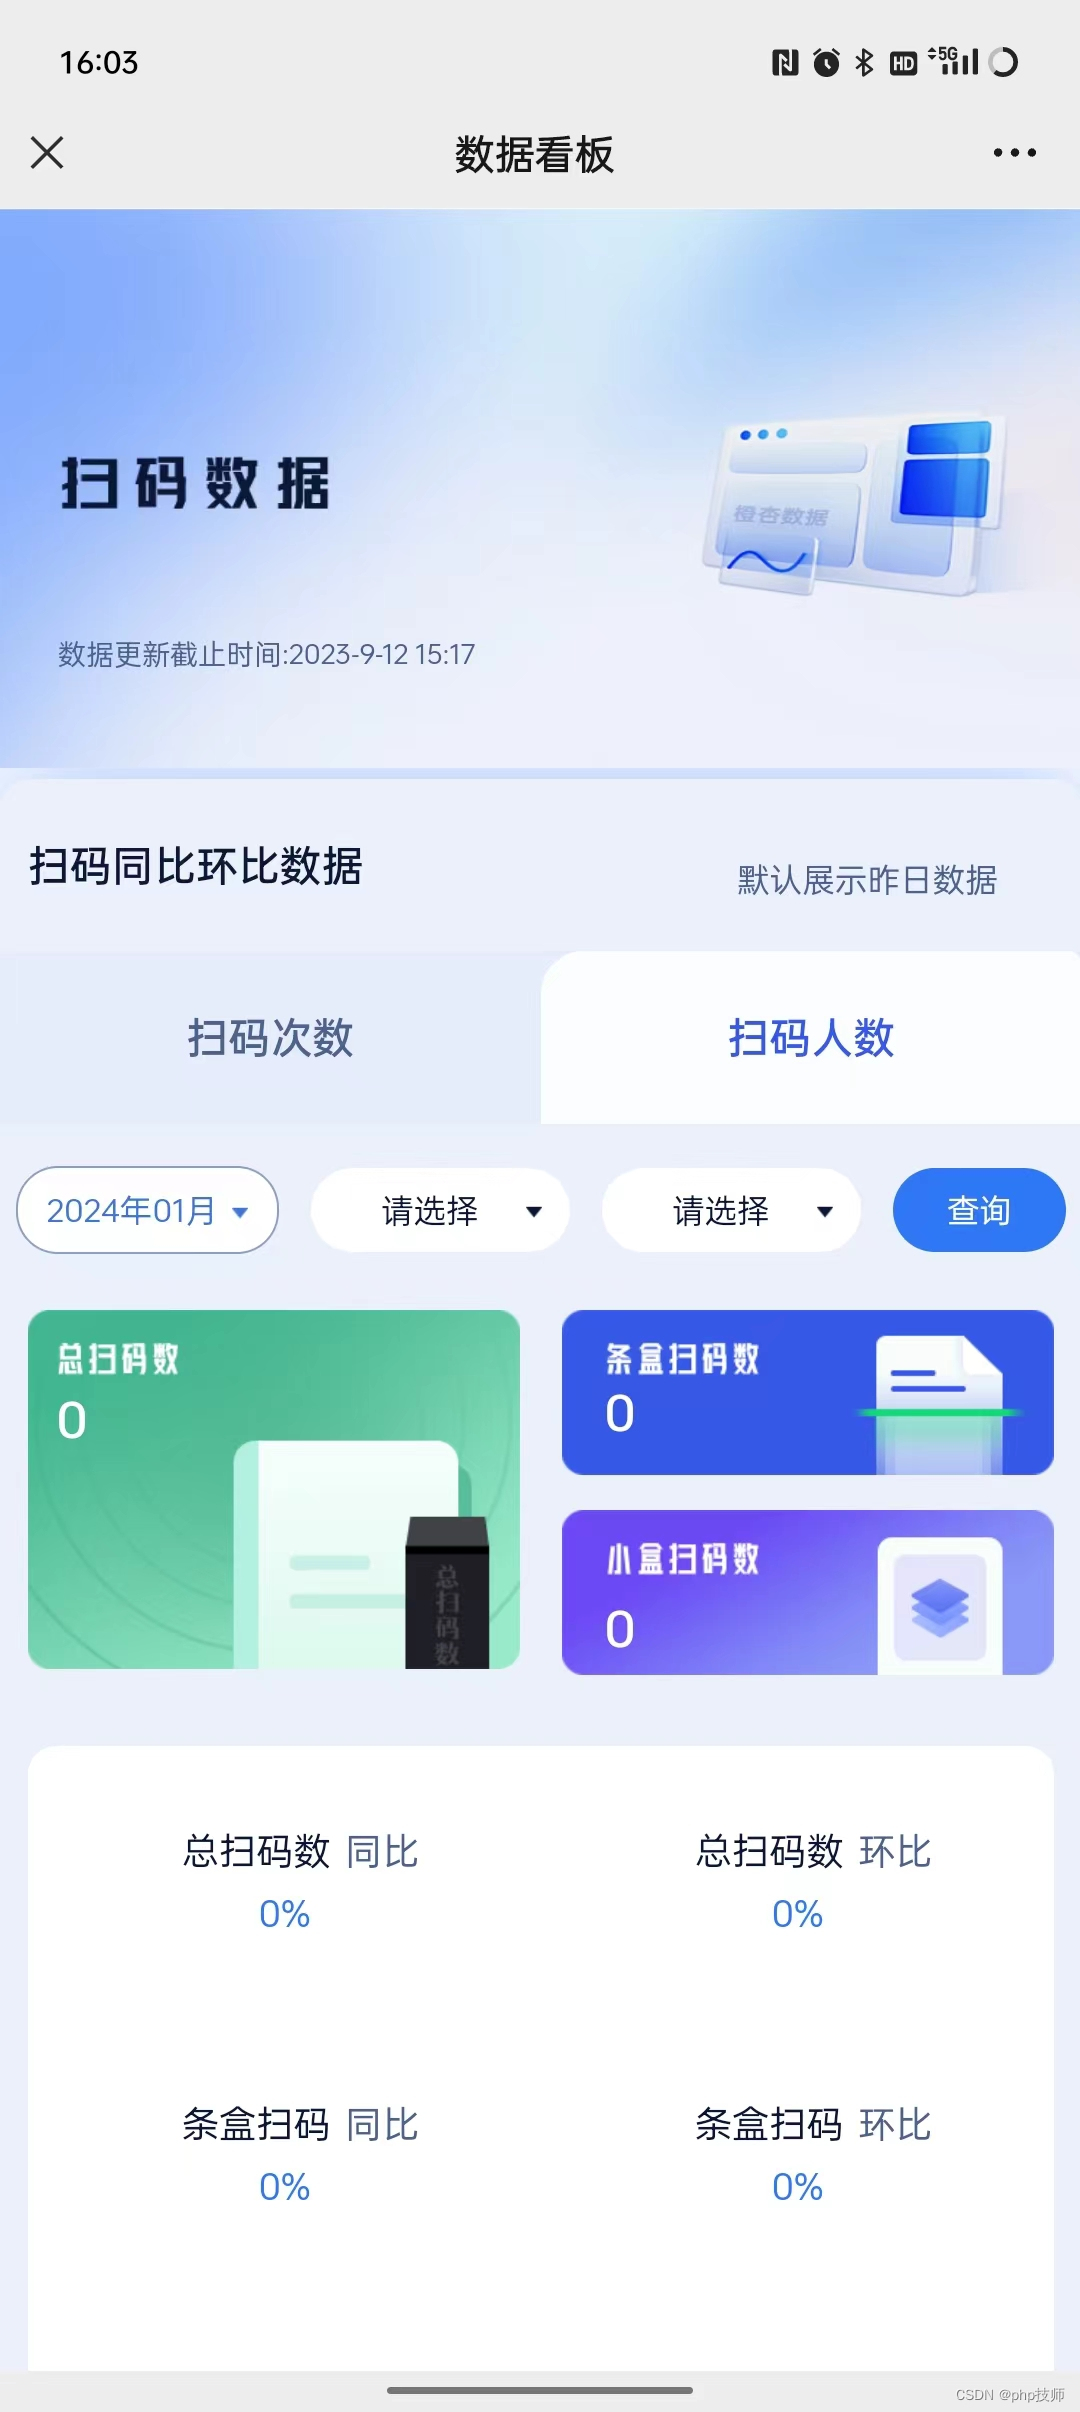
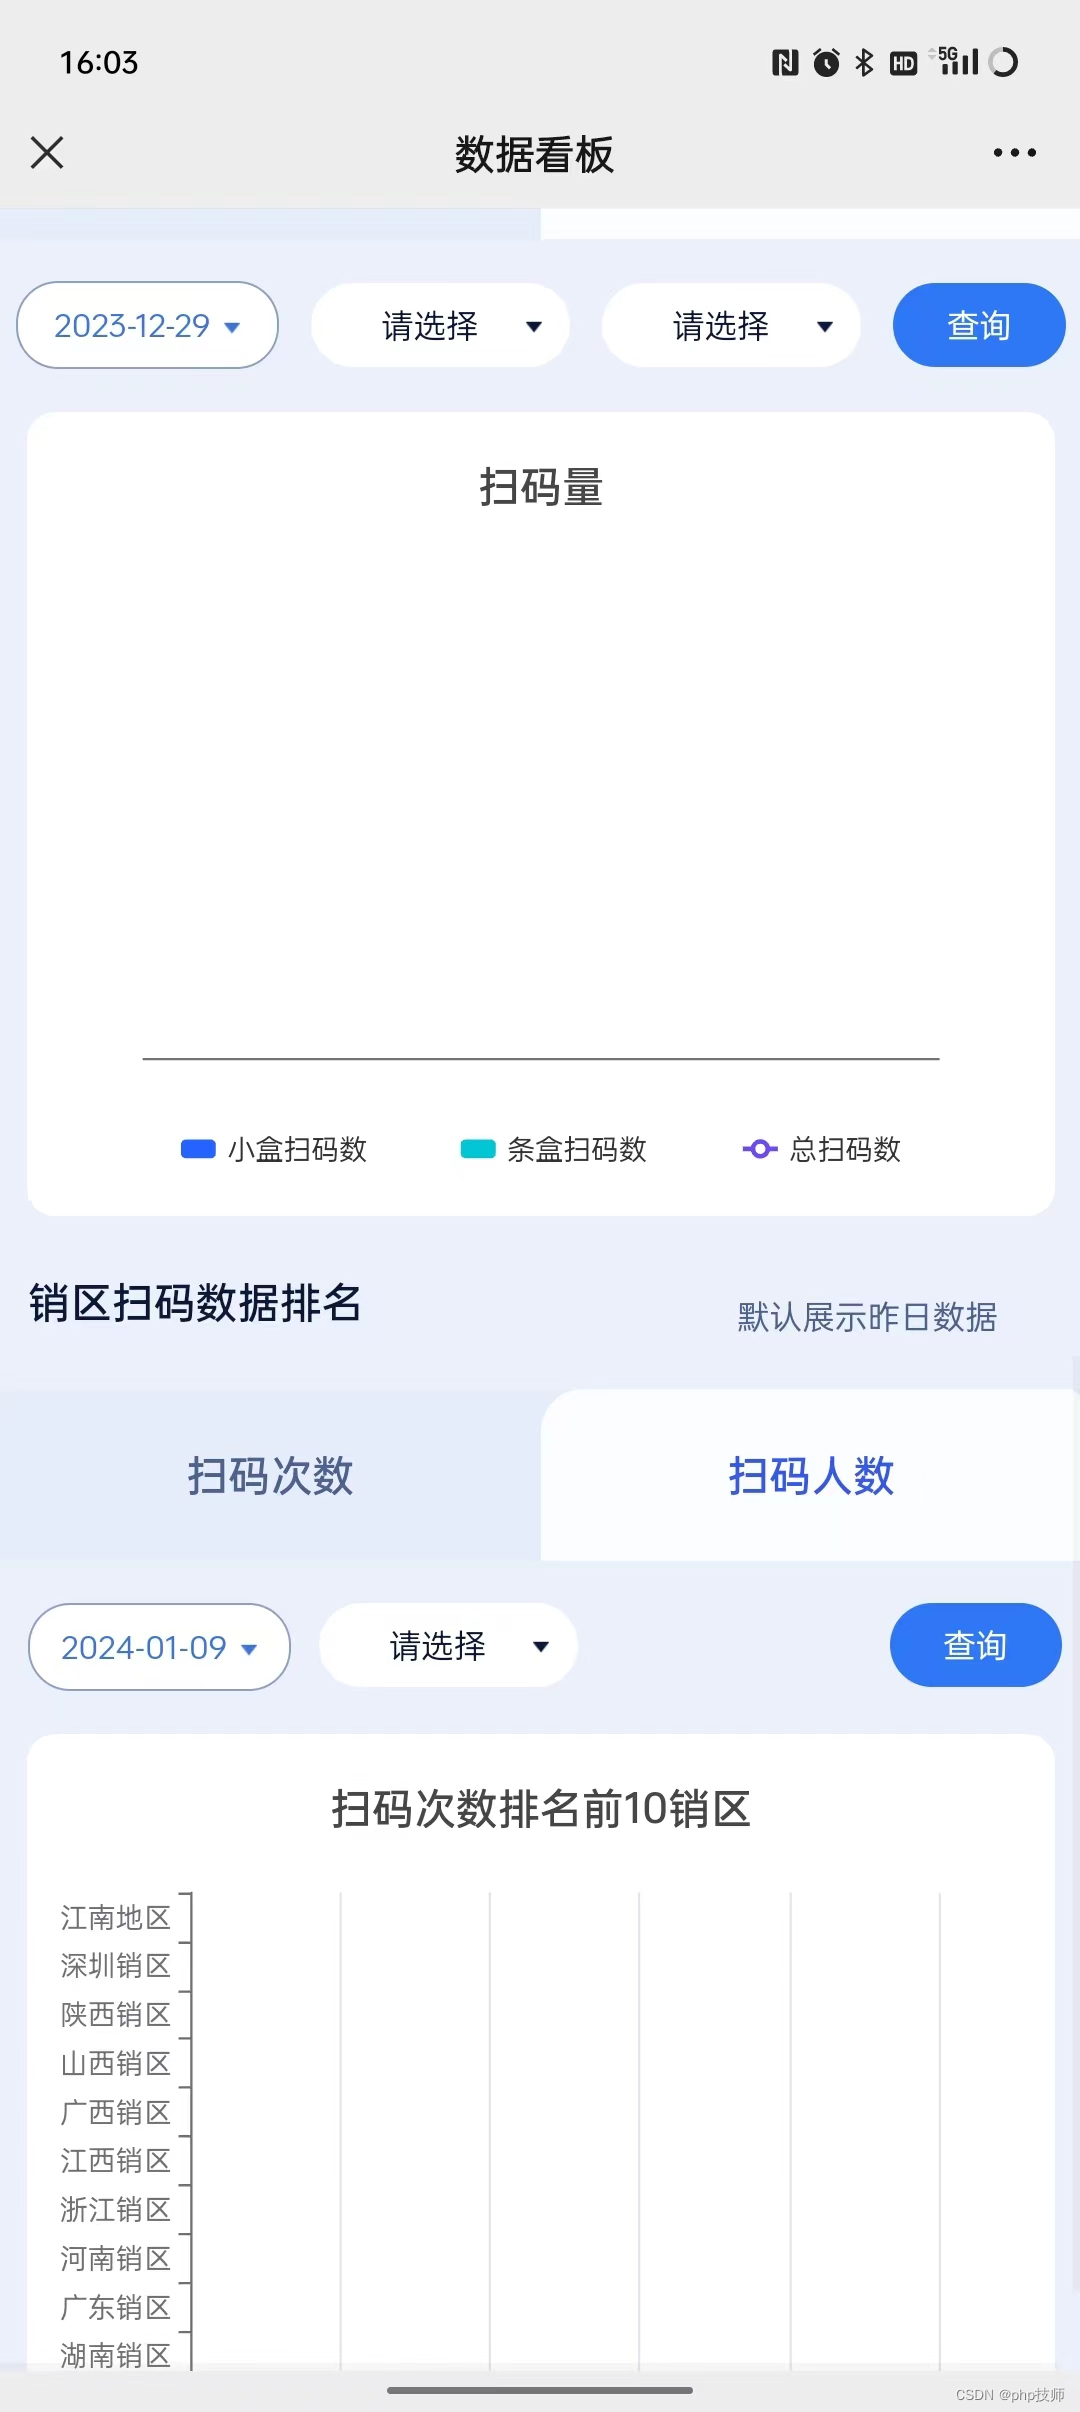
提前10天把中烟活动做完了,以为能打酱油到除夕那天,结果又要做什么数据看板,方便烟草领导过年查看数据,还只给5天时间,真实压榨剥削啊,下辈子再也不‘拍黄片’了,不!下份工作我就转前端了,php我再也不写了。
1.安装echarts 依赖 npm install echarts
2.引用 import * as echarts from ‘echarts’;
3.上代码
<canvas :style="{width: '100%', height: '500rpx'}" id="mychart" canvas-id="mychart":canvas-type="canvasType"></canvas>
chart() {const ctx = document.getElementById('mychart');const chart = echarts.init(ctx);chart.setOption({grid: {// 设置图表距离顶部,左侧,右侧和底部的高度top: '50rpx',left: '50rpx',right: '50rpx',bottom: '50rpx',},color: ["#2363FF", "#03C6D4", "#6B49F5"],title: {left: "center",text: this.ChartDatatext,},tooltip: {width: '100%',trigger: 'axis',axisPointer: {type: 'cross',crossStyle: {color: '#999'}}},legend: {bottom: 0,itemWidth: 15,itemHeight: 8,itemGap: 40,data: ['小盒扫码数', '条盒扫码数', '总扫码数']},xAxis: [{type: 'category',data: this.tongdate,axisPointer: {type: 'shadow'}}],yAxis: [{type: 'value',name: '',min: 0,//max: 0,max: function(value) {return Math.ceil(value.max * 1.2);},interval: 1000,axisLabel: {formatter: '{value}'}},],series: [{name: '小盒扫码数',type: 'bar',data: this.box},{name: '条盒扫码数',type: 'bar',data: this.bar},{name: '总扫码数',type: 'line',data: this.all}]})},
