数据处理
安装openpyxl
!pip install openpyxl -i https://mirrors.aliyun.com/pypi/simple/
数据查看
import pandas as pd
fund = pd.read_excel('./fund.xlsx')
fund.head(10)
| 姓名 | 公司 | 基金数量 | 年 | 天 | 基金规模 | 基金收益 |
|---|
| 0 | 艾定飞 | 华商基金 | 2 | 2 | 135 | 7.23亿元 | 60.88% |
|---|
| 1 | 艾小军 | 国泰基金 | 19 | 7 | 88 | 793.09亿元 | 133.26% |
|---|
| 2 | 安昀 | 长信基金 | 4 | 6 | 353 | 48.11亿元 | 176.47% |
|---|
| 3 | 彬彬 | 人保资产 | 6 | 2 | 85 | 5.23亿元 | 51.72% |
|---|
| 4 | 包兵华 | 鹏华基金 | 4 | 1 | 355 | 148.30亿元 | 102.21% |
|---|
| 5 | 白冰洋 | 中银证券 | 4 | 4 | 174 | 1.84亿元 | 20.95% |
|---|
| 6 | 薄官辉 | 银华基金 | 5 | 5 | 347 | 34.73亿元 | 160.91% |
|---|
| 7 | 边慧 | 银华基金 | 2 | 0 | 14 | 44.33亿元 | 0.15% |
|---|
| 8 | 白海峰 | 招商基金 | 10 | 4 | 332 | 30.00亿元 | 93.60% |
|---|
| 9 | 白洁 | 中银基金 | 13 | 10 | 26 | 1161.36亿元 | 44.71% |
|---|
fund.shape
fund['公司'].nunique()
fund['基金数量'].sum()
cond = fund['基金规模'].str.endswith('亿元')
fund2 = fund[cond]
size = fund2['基金规模'].str[:-2].astype('float').sum()
size
数据清洗转换
cond = fund['基金规模'].str.endswith('亿元')
fund = fund[cond]
cond2 = fund['基金规模'].str[:-2].astype('float') > 1
fund = fund[cond2]
cond3 = fund['基金收益'].str.endswith('%')
fund = fund[cond3]
fund.to_excel('./fund_clean.xlsx', index = False)
fund.head()
| 姓名 | 公司 | 基金数量 | 年 | 天 | 基金规模 | 基金收益 |
|---|
| 0 | 艾定飞 | 华商基金 | 2 | 2 | 135 | 7.23亿元 | 60.88% |
|---|
| 1 | 艾小军 | 国泰基金 | 19 | 7 | 88 | 793.09亿元 | 133.26% |
|---|
| 2 | 安昀 | 长信基金 | 4 | 6 | 353 | 48.11亿元 | 176.47% |
|---|
| 3 | 彬彬 | 人保资产 | 6 | 2 | 85 | 5.23亿元 | 51.72% |
|---|
| 4 | 包兵华 | 鹏华基金 | 4 | 1 | 355 | 148.30亿元 | 102.21% |
|---|
fund = pd.read_excel('./fund_clean.xlsx')
fund['基金规模'] = fund['基金规模'].str[:-2].astype('float')
fund['基金收益'] = fund['基金收益'].str[:-1].astype('float')
fund.columns = ['姓名', '公司', '基金数量', '年', '天','基金规模(亿元)', '基金收益(%)']
fund.to_excel('./fund_result.xlsx',index = False)
fund.head(10)
| 姓名 | 公司 | 基金数量 | 年 | 天 | 基金规模(亿元) | 基金收益(%) |
|---|
| 0 | 艾定飞 | 华商基金 | 2 | 2 | 135 | 7.23 | 60.88 |
|---|
| 1 | 艾小军 | 国泰基金 | 19 | 7 | 88 | 793.09 | 133.26 |
|---|
| 2 | 安昀 | 长信基金 | 4 | 6 | 353 | 48.11 | 176.47 |
|---|
| 3 | 彬彬 | 人保资产 | 6 | 2 | 85 | 5.23 | 51.72 |
|---|
| 4 | 包兵华 | 鹏华基金 | 4 | 1 | 355 | 148.30 | 102.21 |
|---|
| 5 | 白冰洋 | 中银证券 | 4 | 4 | 174 | 1.84 | 20.95 |
|---|
| 6 | 薄官辉 | 银华基金 | 5 | 5 | 347 | 34.73 | 160.91 |
|---|
| 7 | 边慧 | 银华基金 | 2 | 0 | 14 | 44.33 | 0.15 |
|---|
| 8 | 白海峰 | 招商基金 | 10 | 4 | 332 | 30.00 | 93.60 |
|---|
| 9 | 白洁 | 中银基金 | 13 | 10 | 26 | 1161.36 | 44.71 |
|---|
数据可视化
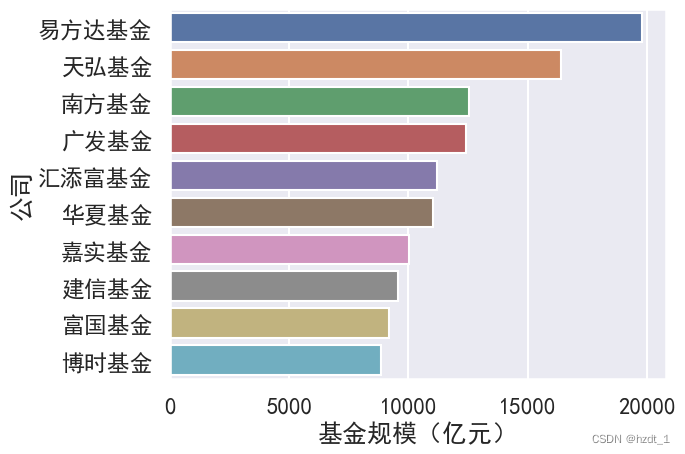
基金规模前10公司
%%time
import pandas as pd
import matplotlib.pyplot as plt
import seaborn as snsplt.figure(figsize=(12,9))sns.set_theme(style='darkgrid',context = 'talk',font='SimHei')fund = pd.read_excel('./fund_result.xlsx')
com = fund.groupby(by = '公司')[['基金规模(亿元)']].sum()
com.sort_values(by = '基金规模(亿元)',ascending = False, inplace = True)
com.reset_index(inplace = True)
com.head()
Wall time: 305 ms
| 公司 | 基金规模(亿元) |
|---|
| 0 | 易方达基金 | 19795.79 |
|---|
| 1 | 天弘基金 | 16402.23 |
|---|
| 2 | 南方基金 | 12535.71 |
|---|
| 3 | 广发基金 | 12398.20 |
|---|
| 4 | 汇添富基金 | 11204.00 |
|---|
sns.barplot(x = '基金规模(亿元)',y = '公司',data = com.iloc[:10],orient='h')plt.savefig('./十大基金公司.png',dpi = 200)

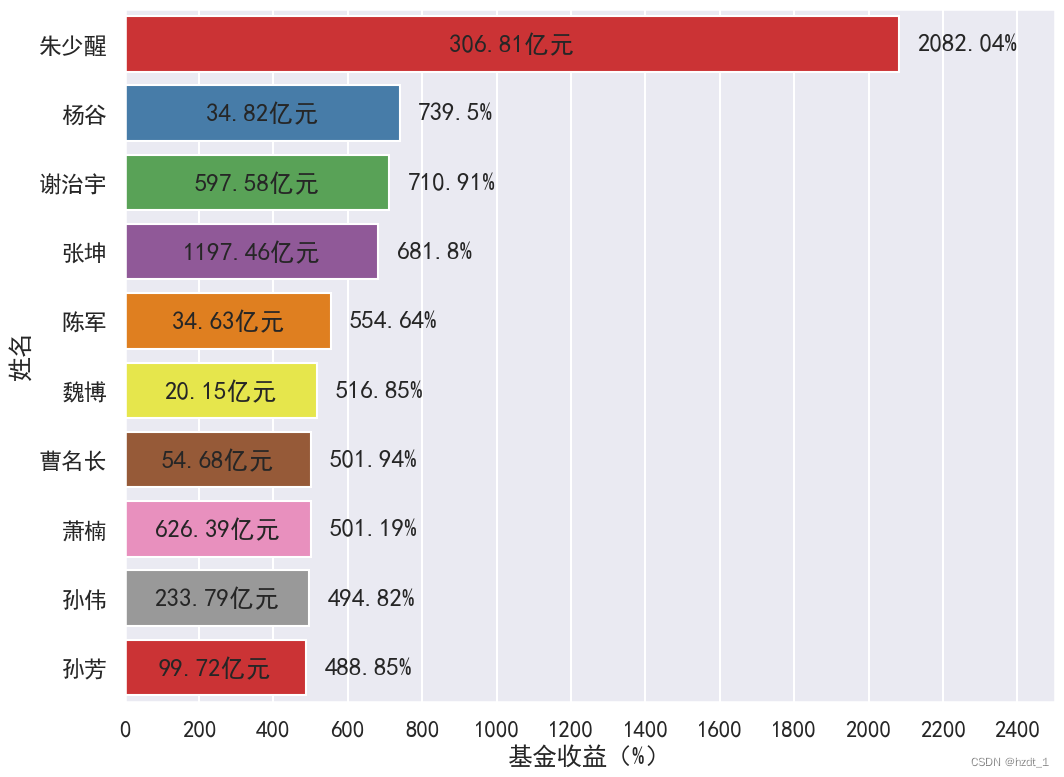
收益十佳基金经理
import numpy as npfund = pd.read_excel('./fund_result.xlsx')
fund.sort_values(by = '基金收益(%)',ascending=False, inplace=True)
fund.iloc[:10]
| 姓名 | 公司 | 基金数量 | 年 | 天 | 基金规模(亿元) | 基金收益(%) |
|---|
| 2179 | 朱少醒 | 富国基金 | 2 | 15 | 148 | 306.81 | 2082.04 |
|---|
| 1802 | 杨谷 | 诺安基金 | 1 | 15 | 50 | 34.82 | 739.50 |
|---|
| 1769 | 谢治宇 | 兴证全球基金 | 4 | 8 | 72 | 597.58 | 710.91 |
|---|
| 2083 | 张坤 | 易方达基金 | 4 | 8 | 195 | 1197.46 | 681.80 |
|---|
| 48 | 陈军 | 东吴基金 | 2 | 13 | 288 | 34.63 | 554.64 |
|---|
| 1370 | 魏博 | 中欧基金 | 5 | 8 | 239 | 20.15 | 516.85 |
|---|
| 88 | 曹名长 | 中欧基金 | 8 | 14 | 111 | 54.68 | 501.94 |
|---|
| 1698 | 萧楠 | 易方达基金 | 6 | 8 | 195 | 626.39 | 501.19 |
|---|
| 1287 | 孙伟 | 民生加银基金 | 12 | 6 | 278 | 233.79 | 494.82 |
|---|
| 1220 | 孙芳 | 上投摩根基金 | 5 | 9 | 125 | 99.72 | 488.85 |
|---|
plt.figure(figsize=(12,9))
sns.set_theme(style='darkgrid',context = 'talk', font='SimHei')
sns.barplot(x = '基金收益(%)',y = '姓名',data = fund.iloc[:10], orient='h',palette = 'Set1')for i in range(10):rate = fund.iloc[i]['基金收益(%)']pe = fund.iloc[i]['基金规模(亿元)']plt.text(x = rate/2, y = i,s = str(pe) + '亿元',ha = 'center',va = 'center')plt.text(x = rate + 50,y = i,s = str(rate) + '%',va = 'center')plt.xlim(0,2500)
plt.xticks(np.arange(0,2500,200))
plt.savefig('./收益十佳基金经理.png', dpi = 100)


