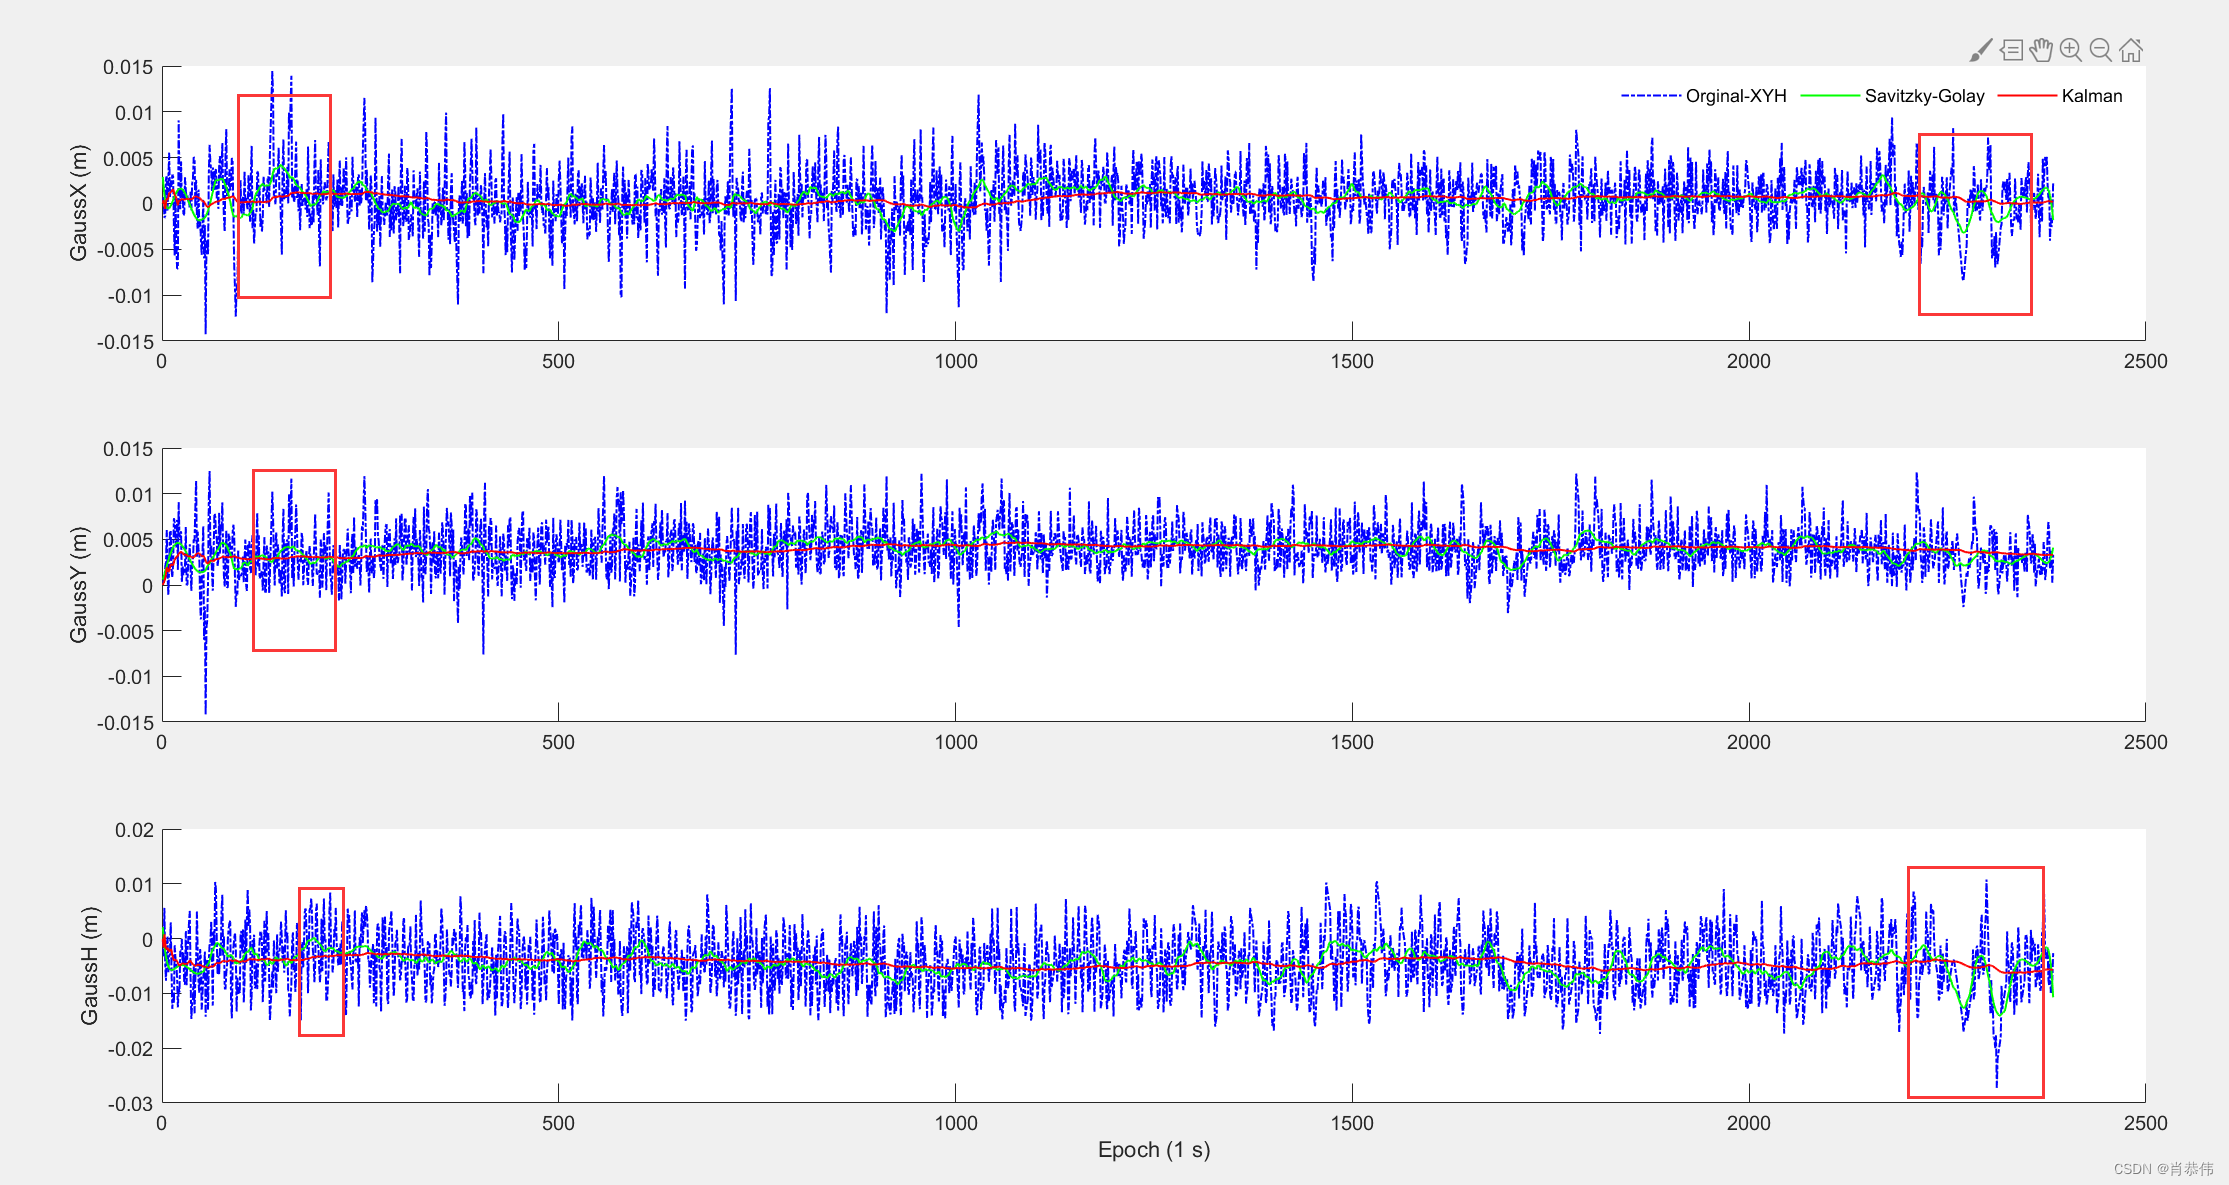
分别使用SG滤波和Kalman滤波对比了平滑RTK解算的1s基线变化高斯坐标系XYH如下图:
从红框可以看出,SG滤波一定程度反应了波动情况,kalman滤波没有反映出来(PS:当然也可能和我设置参数有关,大家可以尝试)
matlab代码如下:
clear
clc
% close all
load RTK.mat%% 滤波算法
Q=0.005; R=100;
[Xfilter1, Pfilter1] = kalmanFor1D( diffpos(:,1),Q, R);% kalman滤波,内部噪声参数已经调好
[smoothZTD1] = smooth( diffpos(:,1),100 , 'sgolay',6);% SG滤波100个点作为弧段用6阶多项式拟合[Xfilter2, Pfilter2] = kalmanFor1D( diffpos(:,2),Q, R);% kalman滤波,内部噪声参数已经调好
[smoothZTD2] = smooth( diffpos(:,2),100 , 'sgolay',6);% SG滤波100个点作为弧段用6阶多项式拟合[Xfilter3, Pfilter3] = kalmanFor1D( diffpos(:,3),Q, R);% kalman滤波,内部噪声参数已经调好
[smoothZTD3] = smooth( diffpos(:,3),100 , 'sgolay',6);% SG滤波100个点作为弧段用6阶多项式拟合%% 滤波曲线
h_fig = figure('name', 'plot','unit','centimeters', 'position',[1 1 12.9 10]);
subplot(3,1,1)
hold on
plot(diffpos(:,1), 'b-.','LineWidth',1)
plot(smoothZTD1, 'g','LineWidth',1)
plot(Xfilter1, 'r','LineWidth',1)
ylabel('GaussX (m)')
set(gca,'fontsize',10, 'fontname', 'Arial')
legend('Orginal-XYH', 'Savitzky-Golay', 'Kalman','Orientation','horizontal')
legend('boxoff')
set(gca,'fontsize',10, 'fontname', 'Arial')subplot(3,1,2)
hold on
plot(diffpos(:,2), 'b-.','LineWidth',1)
plot(smoothZTD2, 'g','LineWidth',1)
plot(Xfilter2, 'r','LineWidth',1)
ylabel('GaussY (m)')
set(gca,'fontsize',10, 'fontname', 'Arial')subplot(3,1,3)
hold on
plot(diffpos(:,3), 'b-.','LineWidth',1)
plot(smoothZTD3, 'g','LineWidth',1)
plot(Xfilter3, 'r','LineWidth',1)
ylabel('GaussH (m)')
set(gca,'fontsize',10, 'fontname', 'Arial')
set(gca,'fontsize',10, 'fontname', 'Arial')
xlabel('Epoch (1 s)')


