官网地址:Apache ECharts

一、下载插件并在页面中引入
npm install echarts --save
页面导入:
import * as echarts from 'echarts'
全局导入: main.js 中,导入并注册到全局
import echarts from 'echarts'
Vue.prototype.$echarts = echarts
二、实现效果展示
三、绘制柱状图使用步骤
代码示例
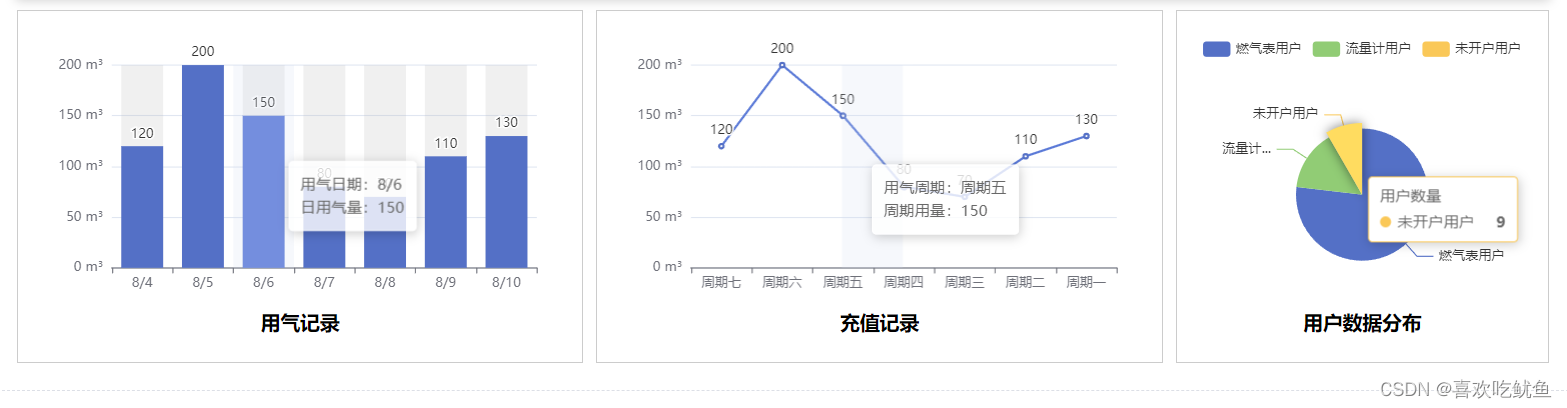
<template><div class="chart"><divid="chart_one"style="height: 82%;padding: 10px;display: flex;align-items: center;justify-content: center;"></div><h2>近一周使用记录</h2></div>
</template><script>import * as echarts from 'echarts'export default {mounted() {// 解决echarts图表放大溢出父容器// 页面上的元素进行监测和调整大小操作,当被监测的元素的大小发生变化时调用setTimeout(() => {const resizeOb = new ResizeObserver((entries) => {for (const entry of entries) {echarts.getInstanceByDom(entry.target).resize()}})resizeOb.observe(document.getElementById('chart_one')) })// 通过id获取echarts元素初始化图表的容器:创建一个 echarts 实例,调用 methods 里的 initChart 进行图表初始化// 获取id为chart_one的dom元素给chartDom容器,init初始化一个echarts实例给myChart,需以dom元素为参数this.$nextTick(() => {this.chartDom = document.getElementById('chart_one')this.myChart = echarts.init(this.chartDom)this.initChart() })// 接口获取数据后,再为echarts赋值this.initData()setTimeout(() => {this.initChart() }, 2000)},methods: {initChart() {// 在 ECharts 的 X 轴上显示当前日期前一周的月日const today = new Date()const lastWeek = new Date(today.getFullYear(),today.getMonth(),today.getDate() - 6) // 最近一周的日期const xAxisData = [] // 存储要显示的日期字符串for (let i = lastWeek.getTime(); i <= today.getTime(); i += 86400000) {const date = new Date(i)xAxisData.push(date.toLocaleDateString('en-US', {month: 'numeric',day: 'numeric',}))}this.option = {// 设置图表的边距,containLabel表示图表内容应包含在边距之内grid: {left: '3%',right: '4%',bottom: '4%',top: '11%',containLabel: true,},// 设置一个图表的 x 轴属性xAxis: {type: 'category',data: xAxisData, // x 轴上的数据axisLabel: {formatter: '{value}', // 显示格式},},yAxis: {type: 'value',axisLabel: {formatter: '{value} m³',},},// 提示框的内容和样式,tooltip: {trigger: 'axis', // 触发方式formatter: '用气日期:{b}<br />日用气量:{c}', // 自定义数据backgroundColor: 'rgba(255, 255, 255, 0.8)',axisPointer: {type: 'shadow',},},// 图表的配置series: [{// data: this.chartonedate, // 显示数据data: [120, 200, 150, 80, 70, 110, 130],type: 'bar', // 图表类型,柱状showBackground: true, // 是否显示柱状图背景色backgroundStyle: {color: 'rgba(180, 180, 180, 0.2)',},label: {// 标签的样式normal: {show: true,position: 'top',},},},],}// 根据 this.option 的值来设置 this.myChart 的选项this.option && this.myChart.setOption(this.option)}, },}
</script>// 根据需要添加类名修改样式
<style lang="scss" scoped>.chart {width: 95%;height: 92%;background: linear-gradient(to bottom, #ffffff, #ffffff);h2 {text-align: center;margin: 0;font-size: 18px;color: #000;}}
</style>
四、绘制折线图、饼图代码整合
<template><el-row :gutter="6"> <el-col :span="9"><div class="ul-one ul-two"><div class="chart"><divid="chart_two"style="height: 82%;padding: 10px;display: flex;align-items: center;justify-content: center;"></div><h2>充值记录</h2></div></div></el-col><el-col :span="6"><div class="ul-one ul-two"><div class="chart"><divid="chart_three"style="height: 82%;padding: 10px;display: flex;align-items: center;justify-content: center;"></div><h2>用户数据分布</h2></div></div></el-col></el-row>
</template><script>import * as echarts from 'echarts'export default {mounted() { setTimeout(() => {const resizeOb = new ResizeObserver((entries) => {for (const entry of entries) {echarts.getInstanceByDom(entry.target).resize()}}) resizeOb.observe(document.getElementById('chart_two'))resizeOb.observe(document.getElementById('chart_three'))}) this.$nextTick(() => {this.chartDom = document.getElementById('chart_one')this.myChart = echarts.init(this.chartDom)this.initChart()this.chartDomtwo = document.getElementById('chart_two')this.myCharttwo = echarts.init(this.chartDomtwo)this.initCharttwo()this.chartDomthree = document.getElementById('chart_three')this.myChartthree = echarts.init(this.chartDomthree)this.initChartthree()}) this.initData()setTimeout(() => { this.initCharttwo()this.initChartthree()}, 2000)},methods: { initCharttwo() {this.optiontwo = {grid: {left: '3%',right: '4%',bottom: '4%',top: '11%',containLabel: true,},xAxis: {type: 'category',data: ['周期七','周期六','周期五','周期四','周期三','周期二','周期一',],},yAxis: {type: 'value',axisLabel: {formatter: '{value} m³',},},tooltip: {trigger: 'axis',formatter: '用气周期:{b}<br />周期用量:{c}', // 自定义数据backgroundColor: 'rgba(255, 255, 255, 0.8)',axisPointer: {type: 'shadow',},},series: [{// data: this.charttwodate,data: [120, 200, 150, 80, 70, 110, 130],type: 'line',// 图表上显示数据,并放置在数据点的上方。label: {normal: {show: true,position: 'top',},},},],}this.optiontwo && this.myCharttwo.setOption(this.optiontwo)},initChartthree() {this.optionthree = {tooltip: {trigger: 'item',},legend: {orient: 'vertical',left: 'left',},// 控制顶部小图标的位置legend: {top: '0',left: 'center',},series: [{name: '用户数量',type: 'pie',radius: '50%',center: ['50%', '60%'],data: [{ value: 83, name: '燃气表用户' },{ value: 16, name: '流量计用户' },{ value: 9, name: '未开户用户' },],emphasis: {itemStyle: {shadowBlur: 10,shadowOffsetX: 0,shadowColor: 'rgba(0, 0, 0, 0.5)',},},},],}this.optionthree && this.myChartthree.setOption(this.optionthree)},},}
</script><style lang="scss" scoped>.ul-two {display: flex;justify-content: space-around;margin: 5px 3px;border: 1px solid #ccc;li {margin: 10px;list-style: none;width: 15%;height: 200px;.ranqibiao {border-radius: 50px;width: 100%;height: 100%;background: url('~@/assets/bg/bg1.png') no-repeat center center;box-shadow: 0 4px 9px 2px rgba(247, 189, 35, 0.91);background-size: cover;display: flex;justify-content: center;}.liuliangji {border-radius: 50px;width: 100%;height: 100%;background: url('~@/assets/bg/bg2.png') no-repeat center center;box-shadow: 0 4px 9px 2px rgba(62, 170, 255, 0.91);background-size: cover;display: flex;justify-content: center;}.weikahu {border-radius: 50px;width: 100%;height: 100%;background: url('~@/assets/bg/bg3.png') no-repeat center center;box-shadow: 0 4px 9px 2px rgba(80, 224, 254, 0.91);background-size: cover;display: flex;justify-content: center;}.image {border-radius: 10px;background: #ffffff;width: 45px;height: 45px;display: flex;align-items: center;justify-content: center;margin-top: 40px;}.text {color: #ffffff;font-weight: bolder;margin-top: 20px;}.number {color: #ffffff;font-size: 20px;font-weight: 800;margin-top: 30px;}}}.val {text-align: center;color: #000;h2 {margin: 10px 0 0 0;}}.ul-one {height: 320px;display: flex;justify-content: center;align-items: center;}.chart {width: 95%;height: 92%;background: linear-gradient(to bottom, #ffffff, #ffffff);h2 {text-align: center;margin: 0;font-size: 18px;color: #000;}}
</style>