前提
-
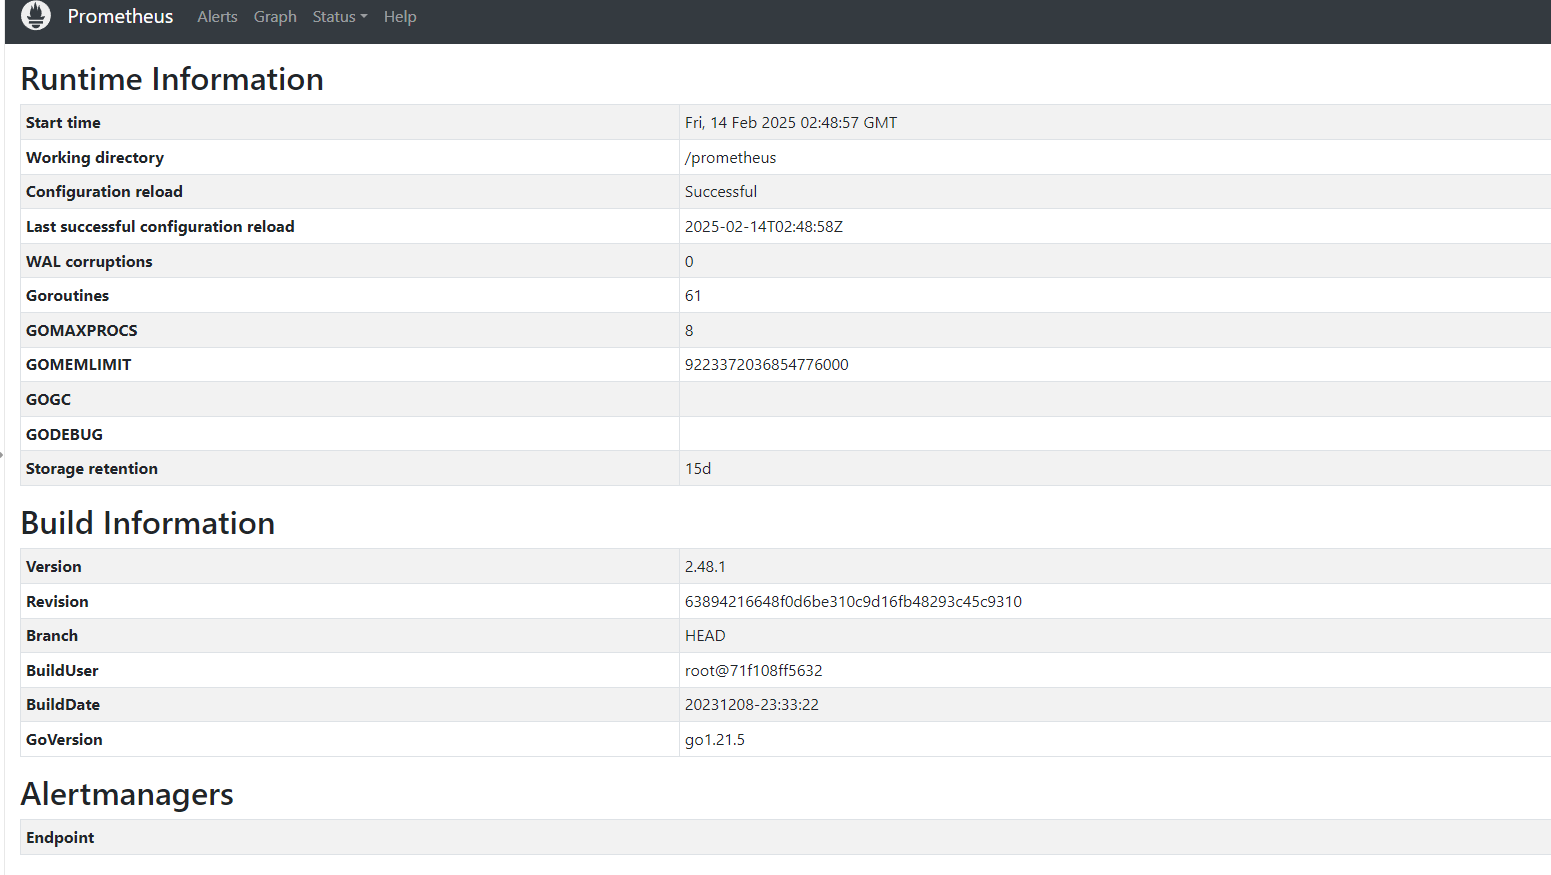
搭建好Prometheus
本次使用Docker搭建
https://www.cnblogs.com/minseo/p/17913003.html -
搭建好Grafana
- 环境查看
系统环境
# cat /etc/redhat-release
CentOS Linux release 7.9.2009 (Core)
# uname -a
Linux CentOS7K8SHarbor061 3.10.0-1160.102.1.el7.x86_64 #1 SMP Tue Oct 17 15:42:21 UTC 2023 x86_64 x86_64 x86_64 GNU/Linux
软件环境
Prometheus版本
mysqld_exporter版本
# ./mysqld_exporter --version
mysqld_exporter, version 0.14.0 (branch: HEAD, revision: ca1b9af82a471c849c529eb8aadb1aac73e7b68c)build user:       root@401d370ca42ebuild date:       20220304-16:25:15go version:       go1.17.8platform:         linux/amd64
- 配置MySQL监控
下载mysqld_exporter
下载地址
https://github.com/prometheus/mysqld_exporter/releases
本次下载0.14.0版本
下载后解压缩启动
# 解压
# tar -xf mysqld_exporter-0.14.0.linux-amd64.tar.gz
# cd mysqld_exporter-0.14.0.linux-amd64/
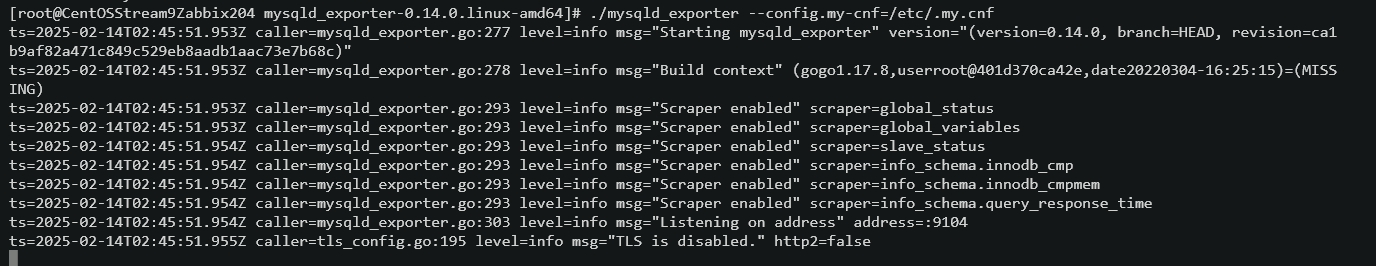
# 带配置文件启动
# ./mysqld_exporter --config.my-cnf=/etc/.my.cnf &
配置文件需要添加数据库信息
# cat /etc/.my.cnf
[client]
user=root
password=root
host=localhost
port=3306
3. 修改prometheus配置文件
修改配置文件添加监控客户端
本次使用的是docker启动修改挂载的配置文件
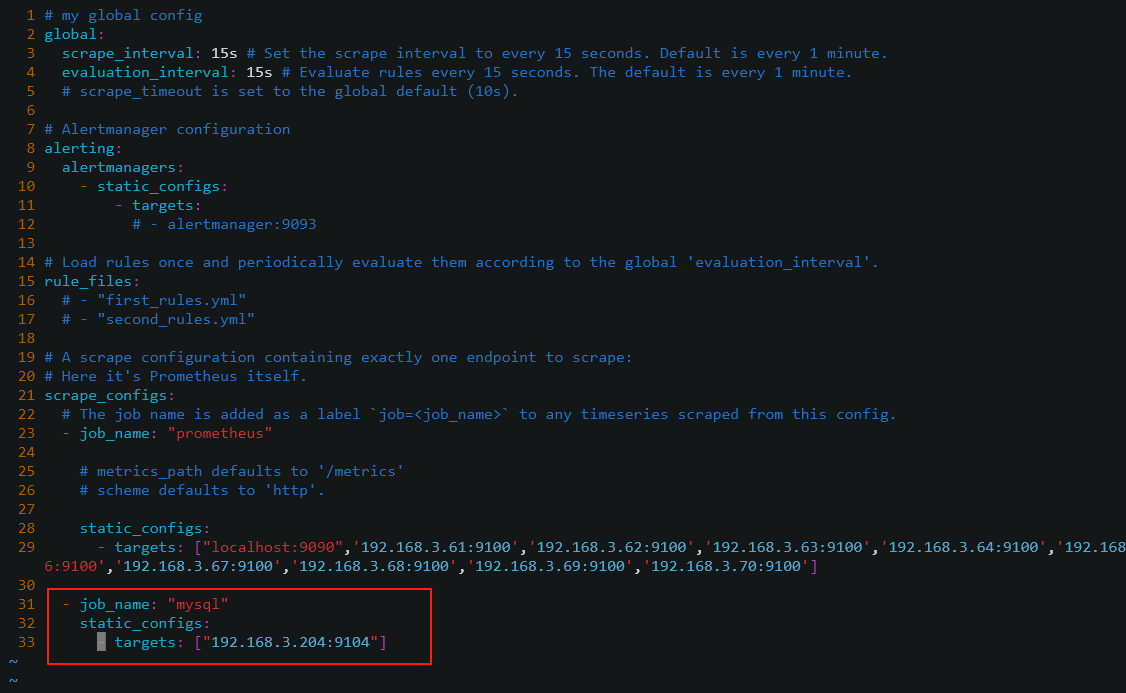
# cat /data/softs/prometheus/prometheus.yml
# my global config
global:scrape_interval: 15s # Set the scrape interval to every 15 seconds. Default is every 1 minute.evaluation_interval: 15s # Evaluate rules every 15 seconds. The default is every 1 minute.# scrape_timeout is set to the global default (10s).# Alertmanager configuration
alerting:alertmanagers:- static_configs:- targets:# - alertmanager:9093# Load rules once and periodically evaluate them according to the global 'evaluation_interval'.
rule_files:# - "first_rules.yml"# - "second_rules.yml"# A scrape configuration containing exactly one endpoint to scrape:
# Here it's Prometheus itself.
scrape_configs:# The job name is added as a label `job=<job_name>` to any timeseries scraped from this config.- job_name: "prometheus"# metrics_path defaults to '/metrics'# scheme defaults to 'http'.static_configs:- targets: ["localhost:9090",'192.168.3.61:9100','192.168.3.62:9100','192.168.3.63:9100','192.168.3.64:9100','192.168.3.65:9100','192.168.3.66:9100','192.168.3.67:9100','192.168.3.68:9100','192.168.3.69:9100','192.168.3.70:9100']- job_name: "mysql"static_configs:- targets: ["192.168.3.204:9104"]
本次添加以下配置
重启对应容器使配置生效
# docker restart prometheus
- Grafana添加仪表盘
下载监控Json模板
下载地址
https://grafana.com/grafana/dashboards/7362-mysql-overview/
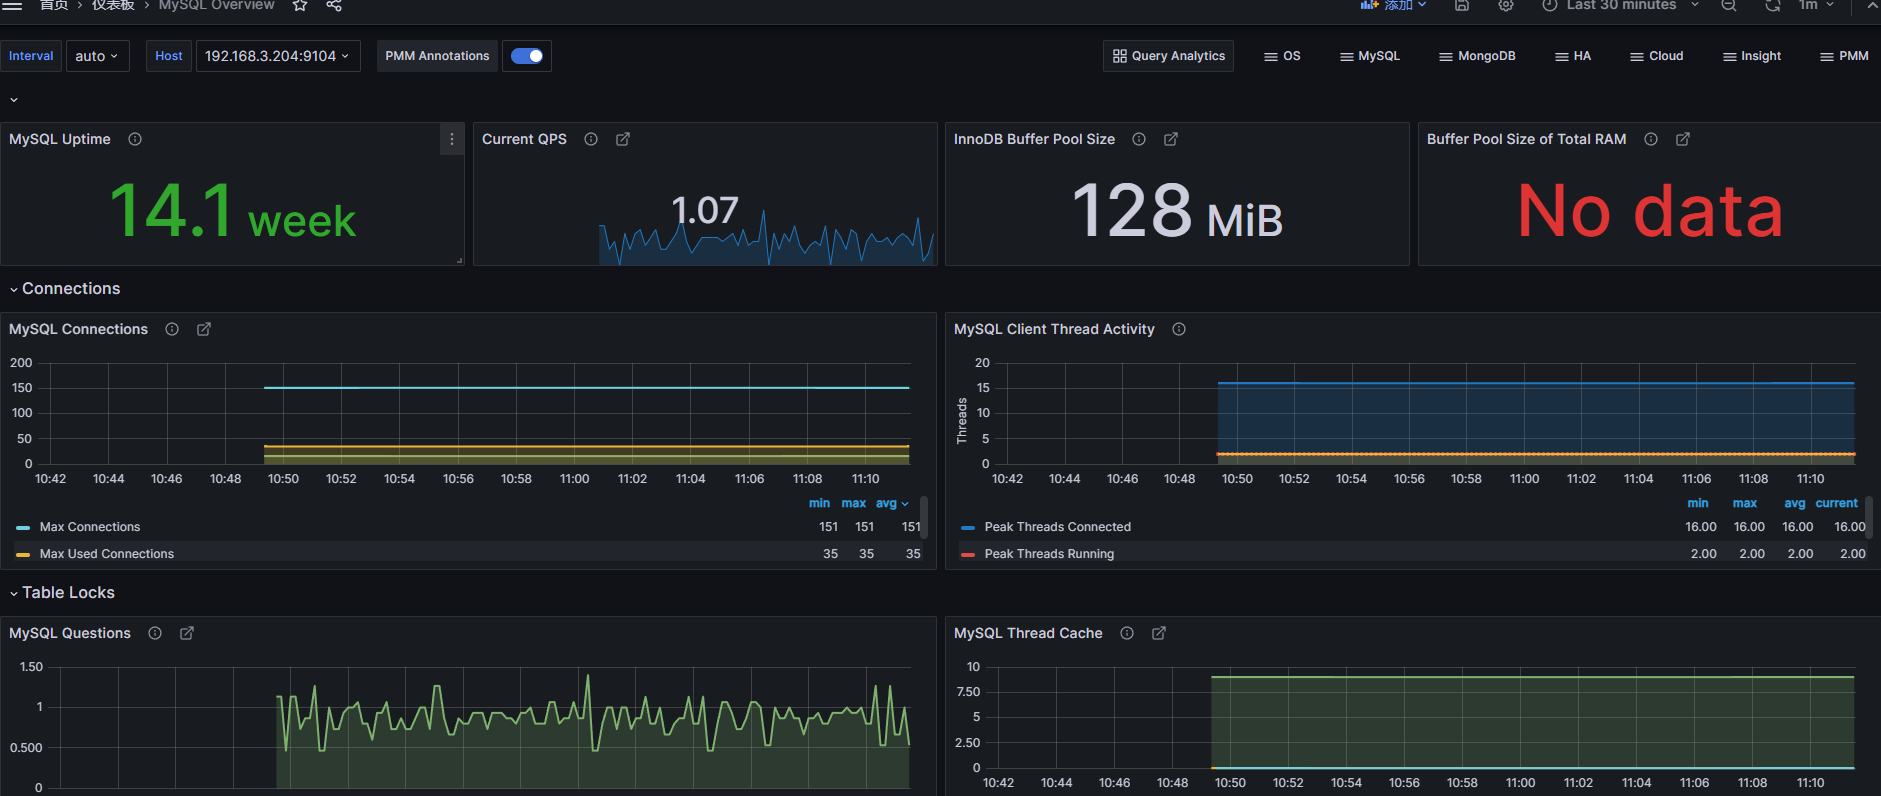
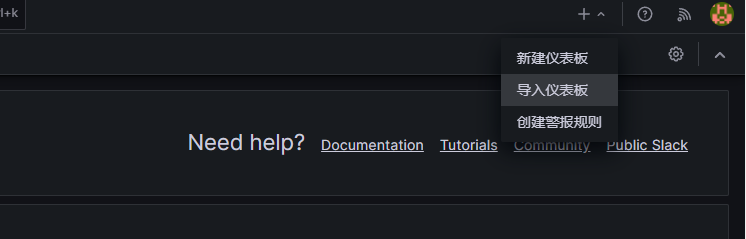
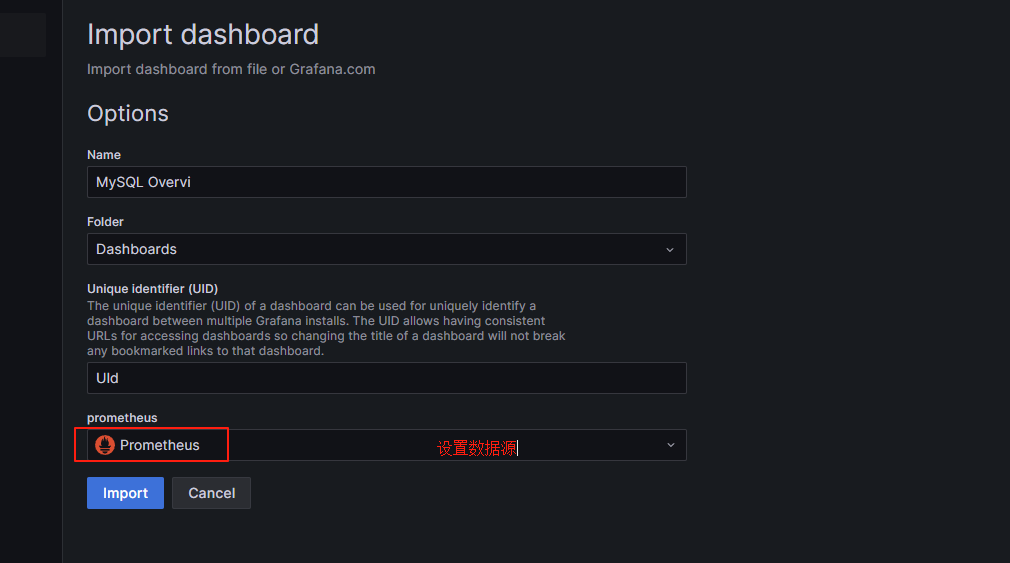
Grafana导入仪表盘
查看监控项