借鉴网上开源分享 https://blog.csdn.net/weixin_49668076/article/details/114263986
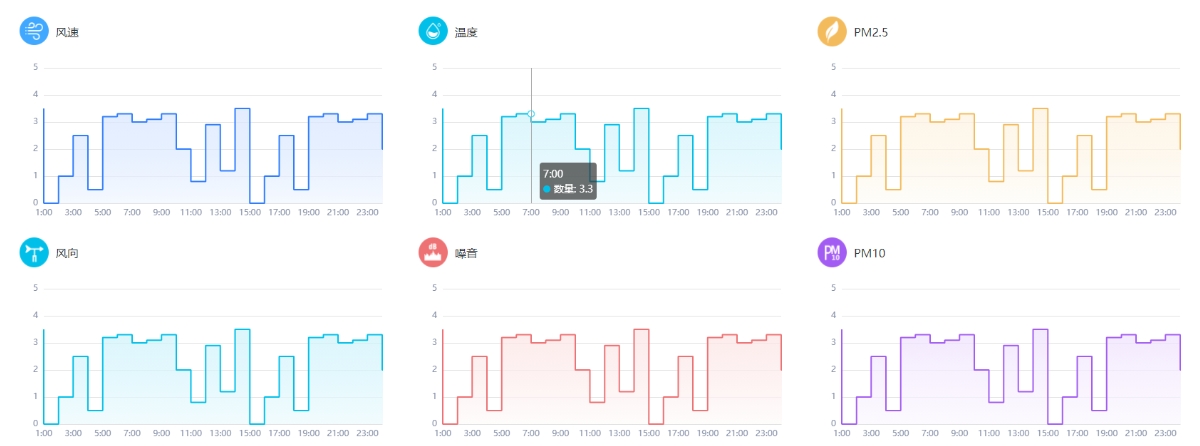
<template><!-- 实时数据图表 --><div class="main-container"><el-row class="totalEchart"><el-col :span="8" :key="index" v-for="(item, index) in tmpList" class="tmplist"><img :src="item.path" alt="" /><span>{{ item.title }}</span><el-col :span="8" v-for="(item, index) in list" :key="index"></el-col><div class="roseChart"></div></el-col></el-row></div>
</template>
<script>
export default {name: "",components: {},props: {},data() {return {tmpList: [{ id: 1, path: require("@/assets/images/jiance/jiance1.png"), title: "风速" },{ id: 2, path: require("@/assets/images/jiance/jiance2.png"), title: "温度" },{ id: 3, path: require("@/assets/images/jiance/jiance3.png"), title: "PM2.5" },{ id: 4, path: require("@/assets/images/jiance/jiance4.png"), title: "风向" },{ id: 5, path: require("@/assets/images/jiance/jiance5.png"), title: "噪音" },{ id: 6, path: require("@/assets/images/jiance/jiance6.png"), title: "PM10" },],list: [// 假数据{aData: ["1:00","2:00","3:00","4:00","5:00","6:00","7:00","8:00","9:00","10:00","11:00","12:00","13:00","14:00","15:00","16:00","17:00","18:00","19:00","20:00","21:00","22:00","23:00","24:00",],bData: [3.5,0,1,2.5,0.5,3.2,3.3,3,3.1,3.3,2,0.8,2.9,1.2,3.5,0,1,2.5,0.5,3.2,3.3,3,3.1,3.3,2,0.8,2.9,1.2,],color: "#307EFF",colorLinearb:'#f0f6ff',colorLinearc:'#ddeaff',colorLineart:'#d6e5ff',},{aData: ["1:00","2:00","3:00","4:00","5:00","6:00","7:00","8:00","9:00","10:00","11:00","12:00","13:00","14:00","15:00","16:00","17:00","18:00","19:00","20:00","21:00","22:00","23:00","24:00",],bData: [3.5,0,1,2.5,0.5,3.2,3.3,3,3.1,3.3,2,0.8,2.9,1.2,3.5,0,1,2.5,0.5,3.2,3.3,3,3.1,3.3,2,0.8,2.9,1.2,],color:'#00C0E9',colorLinearb:'#ecfafd',colorLinearc:'#d8f5fc',colorLineart:'#ccf2fb',},{aData: ["1:00","2:00","3:00","4:00","5:00","6:00","7:00","8:00","9:00","10:00","11:00","12:00","13:00","14:00","15:00","16:00","17:00","18:00","19:00","20:00","21:00","22:00","23:00","24:00",],bData: [3.5,0,1,2.5,0.5,3.2,3.3,3,3.1,3.3,2,0.8,2.9,1.2,3.5,0,1,2.5,0.5,3.2,3.3,3,3.1,3.3,2,0.8,2.9,1.2,],color:'#F3BB5C', colorLinearb:'#fefcf7',colorLinearc:'#fdf5e7',colorLineart:'#fdf1de',},{aData: ["1:00","2:00","3:00","4:00","5:00","6:00","7:00","8:00","9:00","10:00","11:00","12:00","13:00","14:00","15:00","16:00","17:00","18:00","19:00","20:00","21:00","22:00","23:00","24:00",],bData: [3.5,0,1,2.5,0.5,3.2,3.3,3,3.1,3.3,2,0.8,2.9,1.2,3.5,0,1,2.5,0.5,3.2,3.3,3,3.1,3.3,2,0.8,2.9,1.2,],color:'#00C0E9',colorLinearb:'#ecfafd',colorLinearc:'#d8f5fc',colorLineart:'#ccf2fb',},{aData: ["1:00","2:00","3:00","4:00","5:00","6:00","7:00","8:00","9:00","10:00","11:00","12:00","13:00","14:00","15:00","16:00","17:00","18:00","19:00","20:00","21:00","22:00","23:00","24:00",],bData: [3.5,0,1,2.5,0.5,3.2,3.3,3,3.1,3.3,2,0.8,2.9,1.2,3.5,0,1,2.5,0.5,3.2,3.3,3,3.1,3.3,2,0.8,2.9,1.2,],color:'#EE7173',colorLinearb:'#fefafa',colorLinearc:'#fdecec',colorLineart:'#fce3e3',},{aData: ["1:00","2:00","3:00","4:00","5:00","6:00","7:00","8:00","9:00","10:00","11:00","12:00","13:00","14:00","15:00","16:00","17:00","18:00","19:00","20:00","21:00","22:00","23:00","24:00",],bData: [3.5,0,1,2.5,0.5,3.2,3.3,3,3.1,3.3,2,0.8,2.9,1.2,3.5,0,1,2.5,0.5,3.2,3.3,3,3.1,3.3,2,0.8,2.9,1.2,],color:'#A35CF3',colorLinearb:'#faf7fe',colorLinearc:'#f5ecfe',colorLineart:'#ede0fd',},],};//     },computed: {},watch: {},created() {},mounted() {this.drawRose();},methods: {// 遍历饼图drawRose() {var echarts = require("echarts");var roseCharts = document.getElementsByClassName("roseChart"); // 对应地使用ByClassNamefor (var i = 0; i < roseCharts.length; i++) {// 通过for循环,在相同class的dom内绘制元素var myChart = echarts.init(roseCharts[i]);myChart.setOption({color: [this.list[i].color],grid: {top: 30,left: 20,right: 20,bottom: 10,containLabel: true,},tooltip: {show: true,trigger: "axis",},xAxis: {type: "category",//data: this.list[i].aData,//渲染每个图标对应的数据axisTick: {show: false,},boundaryGap: false,axisLabel: {show: true,color: "#858fa6", //x轴字体颜色},splitLine: {lineStyle: {width: 1,color: "#E2E2E2",},},axisLine: {lineStyle: {width: 1,color: "#E2E2E2", //x轴线颜色},},},yAxis: {type: "value",axisTick: {show: false,},axisLabel: {color: "#858fa6",},splitLine: {lineStyle: {width: 1,color: "#E2E2E2",},},axisLine: {lineStyle: {width: 0,color: "#E2E2E2",show: false,},},max: 5,},series: [{name: "数量",type: "line",step: "start",//  smooth: true,symbolSize: 3,showSymbol: false,areaStyle: {color: {type: "linear",x: 0,y: 0,x2: 0,y2: 1,colorStops: [{offset: 1,color: this.list[i].colorLinearb, //从下向上,下部分的颜色},{offset: 0.5,color: this.list[i].colorLinearc, //从下向上,中间部分的颜色},{offset: 0,color: this.list[i].colorLineart, //从下向上,上部分的颜色},],},},data:this.list[i].bData,//渲染每个图标对应的数据},],},true);}},},
};
</script>
<style lang="scss" scoped>
.main-container {width: 100%;margin-top: 40px;.totalEchart {width: 100%;.tmplist {height: 310px;img {width: 42px;height: 42px;vertical-align: middle;}span {vertical-align: middle;margin-left: 10px;}}.roseChart {width: 530px;height: 250px;}}
}
</style>