demo源码运行环境以及配置
- 运行环境:依赖Node安装环境,demo本地Node版本:14.19.1。
- 运行工具:vscode或者其他工具。
- 配置方式:下载demo源码,vscode打开,然后顺序执行以下命令:
(1)下载demo环境依赖包命令:npm i
(2)启动demo命令:npm run dev
(3)打包demo命令: npm run build:release
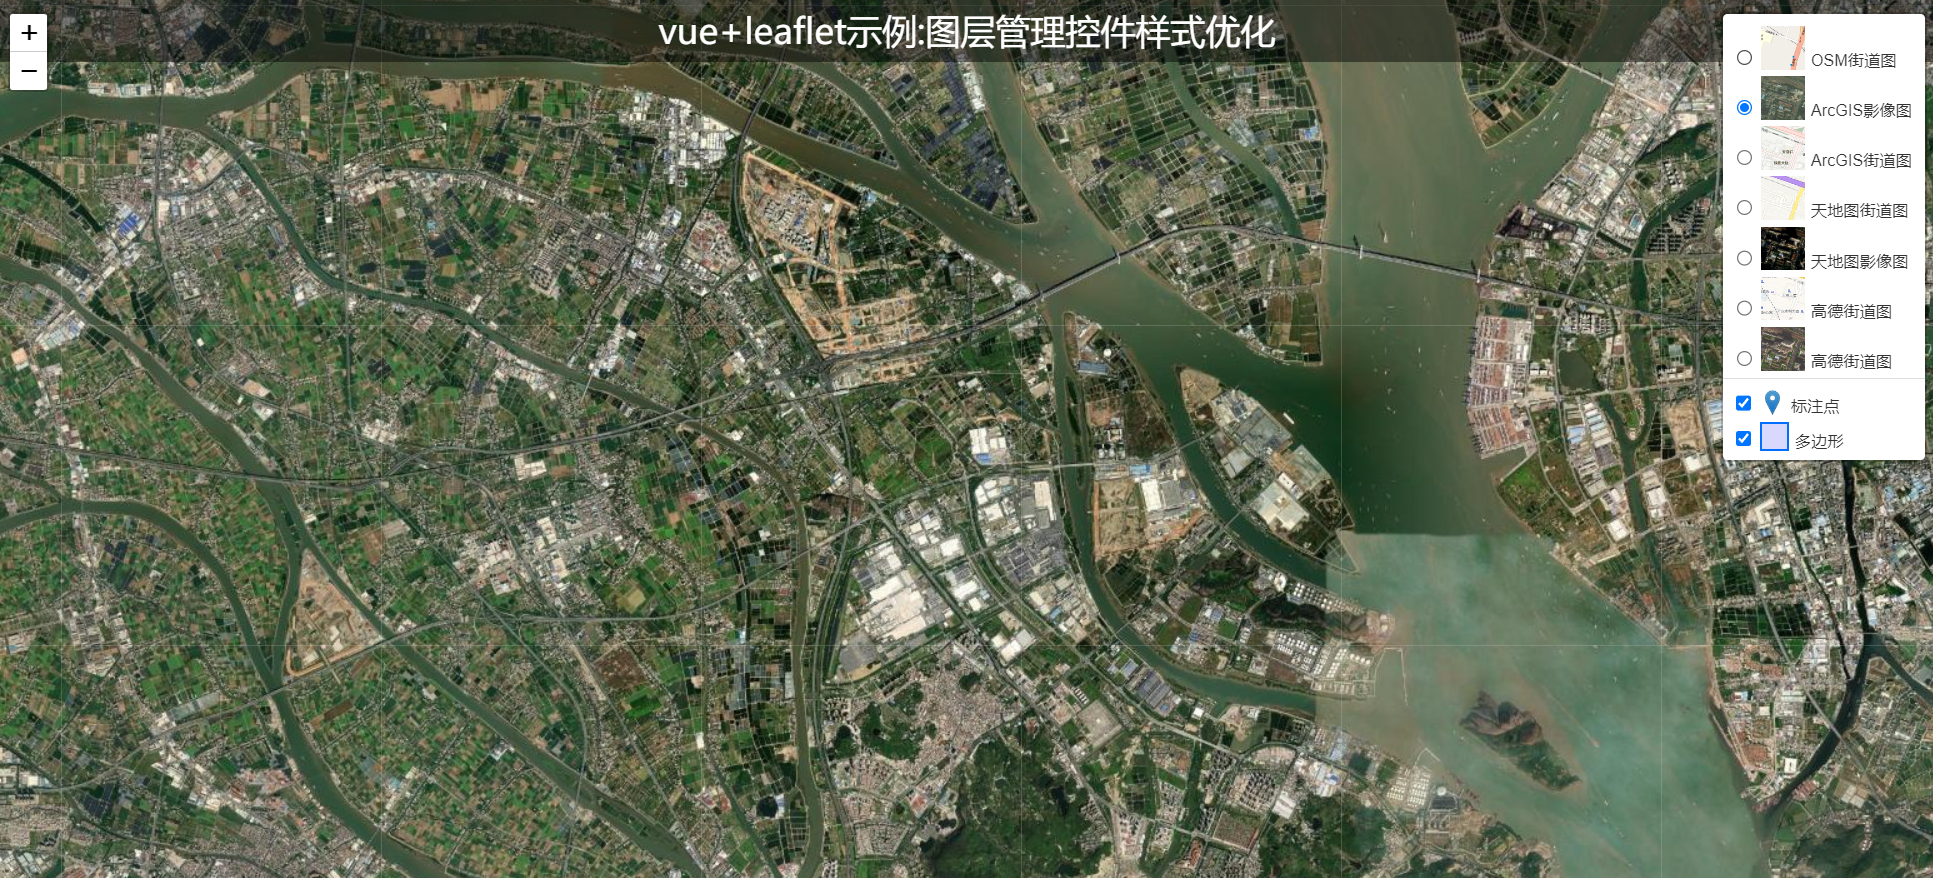
示例效果
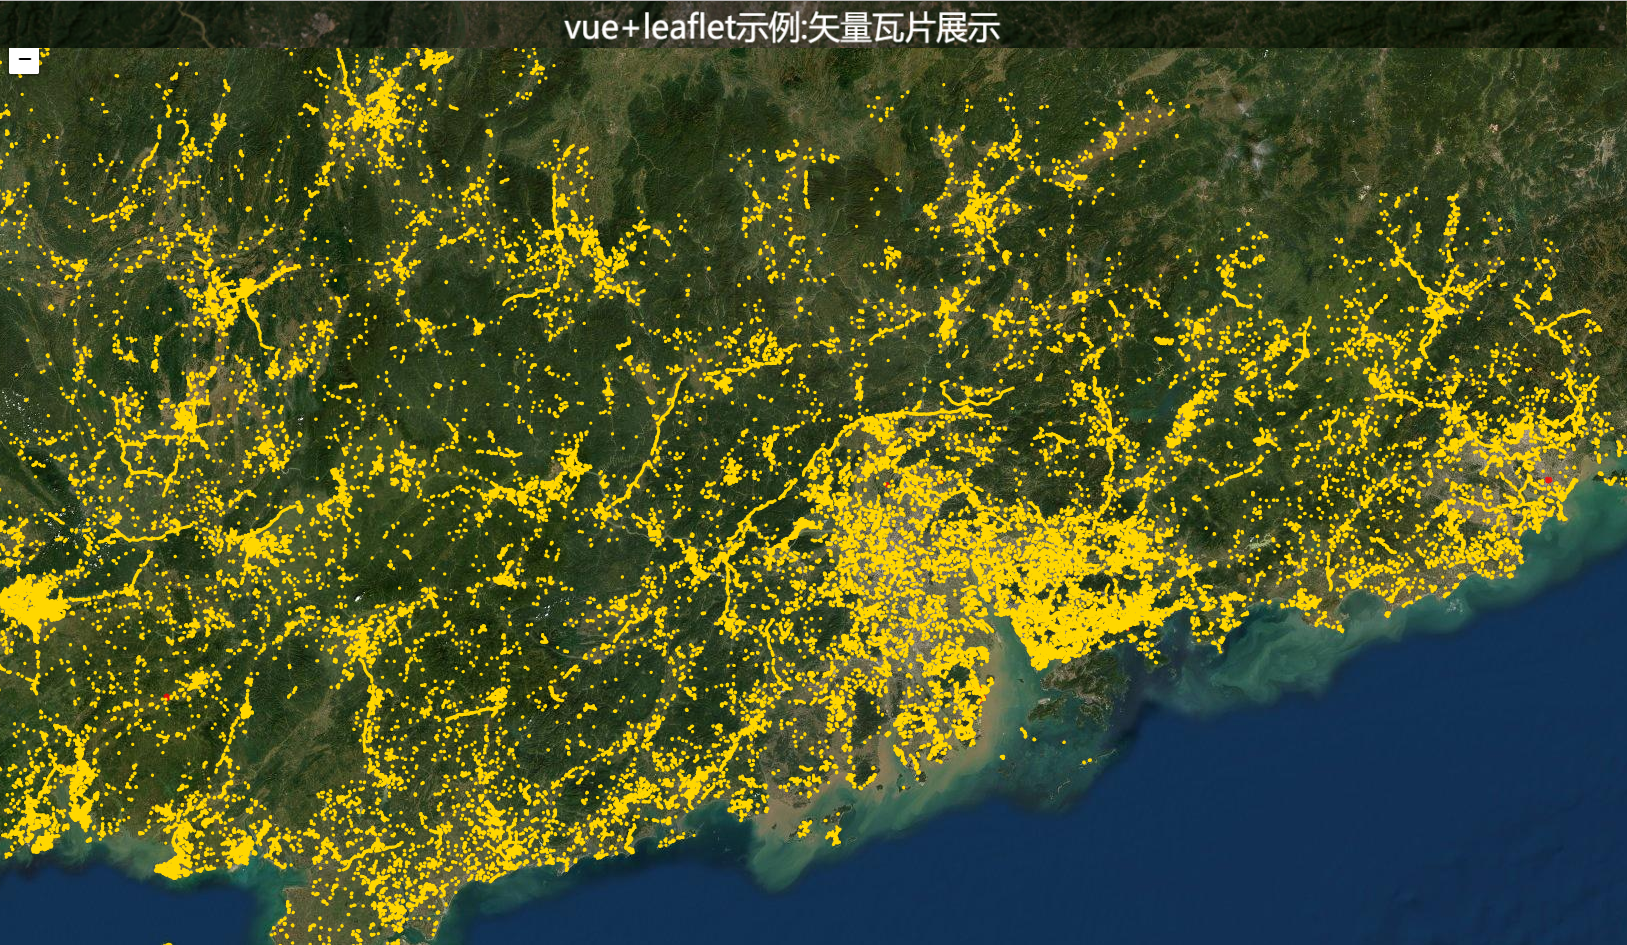
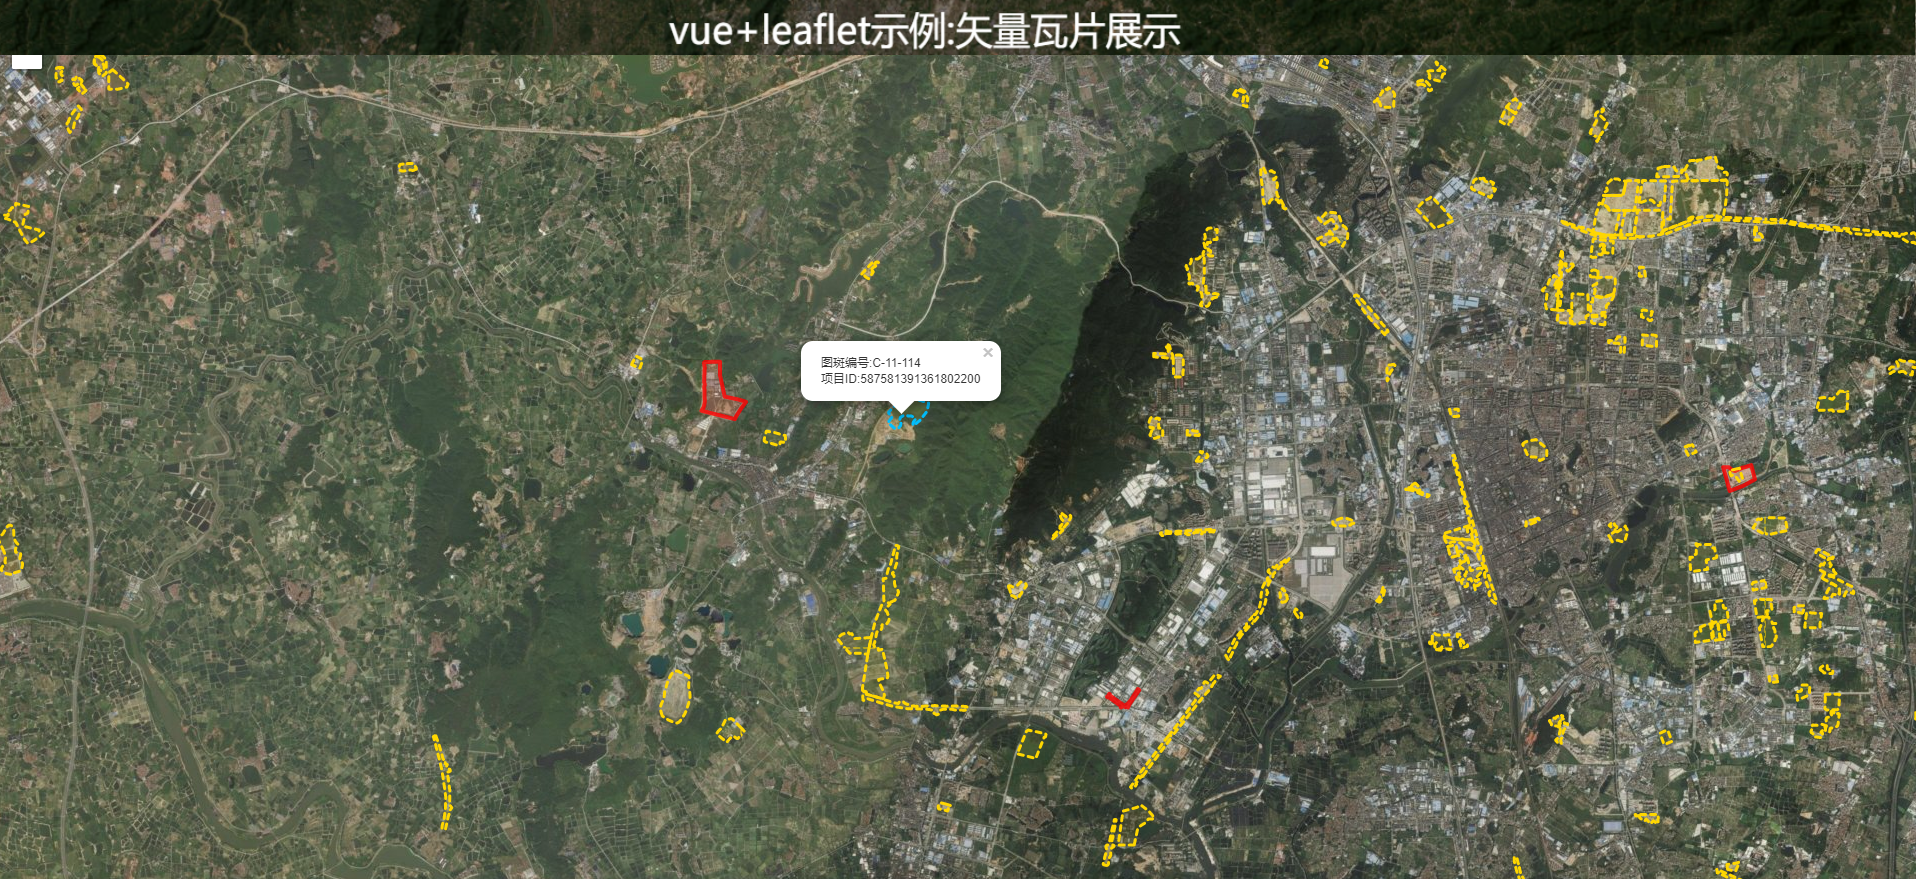
本篇主要利用 leaflet 的插件 leaflet.vectorgrid 实现两种不同数据源的矢量瓦片渲染加载效果:
调用 geoserver 发布的 pbf 矢量瓦片服务
加载 geojson 数据源渲染矢量瓦片
leaflet.vectorgrid 插件 github 地址:https://github.com/Leaflet/Leaflet.VectorGrid
- 实现方式1:调用geoserver发布的pbf矢量瓦片服务
- geoserver 安装矢量瓦片插件,用来拓展支持发布矢量瓦片服务,具体可以参考以下资料:
https://www.jianshu.com/p/6d0cb4d0e432
https://blog.csdn.net/qq_36061233/article/details/84751073
https://blog.csdn.net/qq_28418387/article/details/82823725 - geoserver安装好矢量瓦片以及发布矢量瓦片服务之后,可以利用leaflet.vectorgrid插件来调用矢量瓦片服务渲染加载
- 实现方式2:加载geojson数据源渲染矢量瓦片
- 核心源码
<template><div id="map"></div><div class="titleContainer center"><span>vue+leaflet示例:矢量瓦片展示</span></div>
</template><script setup>
import { onMounted, reactive, ref } from "vue";
import L from "leaflet";
import "leaflet.vectorgrid"; //引用矢量瓦片插件
import config from "../config";
let map = null;
let myConfig = {};
let spothighlight = null;
let geojsonData = null; // demo由于数据保密性,模拟geojson数据源需要自己去构造
//矢量瓦片高亮样式符号style
const highlightstyle = {fillColor: "#e6d933",fillOpacity: 0.1,stroke: true,fill: true,color: "#00bfff",opacity: 1,weight: 3,dashArray: "5",
};
onMounted(() => {initMap();
});
const initMap = () => {// 创建地图对象map = L.map("map", {attributionControl: false,}).setView(config.mapInitParams.center, config.mapInitParams.zoom);//创建底图切换数据源const baseLayer2 = L.tileLayer(config.baseMaps[1].Url); //ArcGIS影像图map.addLayer(baseLayer2);//加载项目红线矢量瓦片loadGeojsonVectorLayer();//加载扰动图斑矢量瓦片loadVectorPbfLayer();//清空图斑高亮效果map.on('click', clearSpotHighlight);
};
//设置图斑的样式
const getSpotVectorStyles = async (layerName) => {let style = {};style[layerName] = function (properties, zoom) {const symbol = {color: "#ffd700",fillColor: "#e6d933",fillOpacity: 0.1,fill: true,opacity: 1,weight: 3,dashArray: "5",};return symbol;};return style;
};
//清空扰动图斑高亮效果
const clearSpotHighlight = async () => {if (spothighlight) {myConfig.spotPbfLayer.resetFeatureStyle(spothighlight);}spothighlight = null;
};
//加载Pbf形式矢量瓦片函数
const loadVectorPbfLayer = async () => {// var localUrl = "http://localhost:8080/geoserver/gwc/service/wmts?" +// "REQUEST=GetTile&SERVICE=WMTS&VERSION=1.0.0&LAYER=ZKYGIS:bs_spot_t" +// "&STYLE=&TILEMATRIX=EPSG:900913:{z}&TILEMATRIXSET=EPSG:900913&" +// "FORMAT=application/x-protobuf;type=mapbox-vector&TILECOL={x}&TILEROW={y}";var localUrl ="http://localhost:8080/geoserver/gwc/service/tms/1.0.0/ZKYGIS:bs_spot_t@EPSG:900913@pbf/{z}/{x}/{-y}.pbf";var localVectorTileOptions = {rendererFactory: L.canvas.tile, //渲染方式 canvas//rendererFactory: L.svg.tile,interactive: true, //设置true,允许鼠标交互事件getFeatureId: function (f) {return f.properties.map_num;},vectorTileLayerStyles: getSpotVectorStyles("bs_spot_t"), //设置矢量渲染的样式符号};myConfig.spotPbfLayer = L.vectorGrid.protobuf(localUrl, localVectorTileOptions).on("mouseover", function (e) {const attr = e.layer.properties;clearSpotHighlight();spothighlight = e.layer.properties.map_num;myConfig.spotPbfLayer.setFeatureStyle(e.layer.properties.map_num,highlightstyle);let content = "图斑编号:" + attr.map_num + "</br>";content += "项目ID:" + attr.project_id + "</br>";myConfig.spotPbfLayer.unbindPopup();myConfig.spotPbfLayer.bindPopup(content);myConfig.spotPbfLayer.openPopup(e.latlng);}).addTo(map);
};
……
</script><style scoped>
#map {width: 100vw;height: 100vh;
}
.titleContainer {position: absolute;top: 0;background: rgba(0, 0, 0, 0.45);height: 50px;width: 100vw;z-index: 999;font-size: 14px;color: #fff;font-size: 28px;
}
.center {display: flex;flex-direction: column;align-items: center;justify-content: center;
}
</style>
geojsonData,geojson模拟数据,由于单位的geoserver地图服务数据保密性,geoserver发布的矢量瓦片数不公开,源码是共享的