demo源码运行环境以及配置
- 运行环境:依赖Node安装环境,demo本地Node版本:14.19.1。
- 运行工具:vscode或者其他工具。
- 配置方式:下载demo源码,vscode打开,然后顺序执行以下命令:
(1)下载demo环境依赖包命令:npm i
(2)启动demo命令:npm run dev
(3)打包demo命令: npm run build:release
示例效果
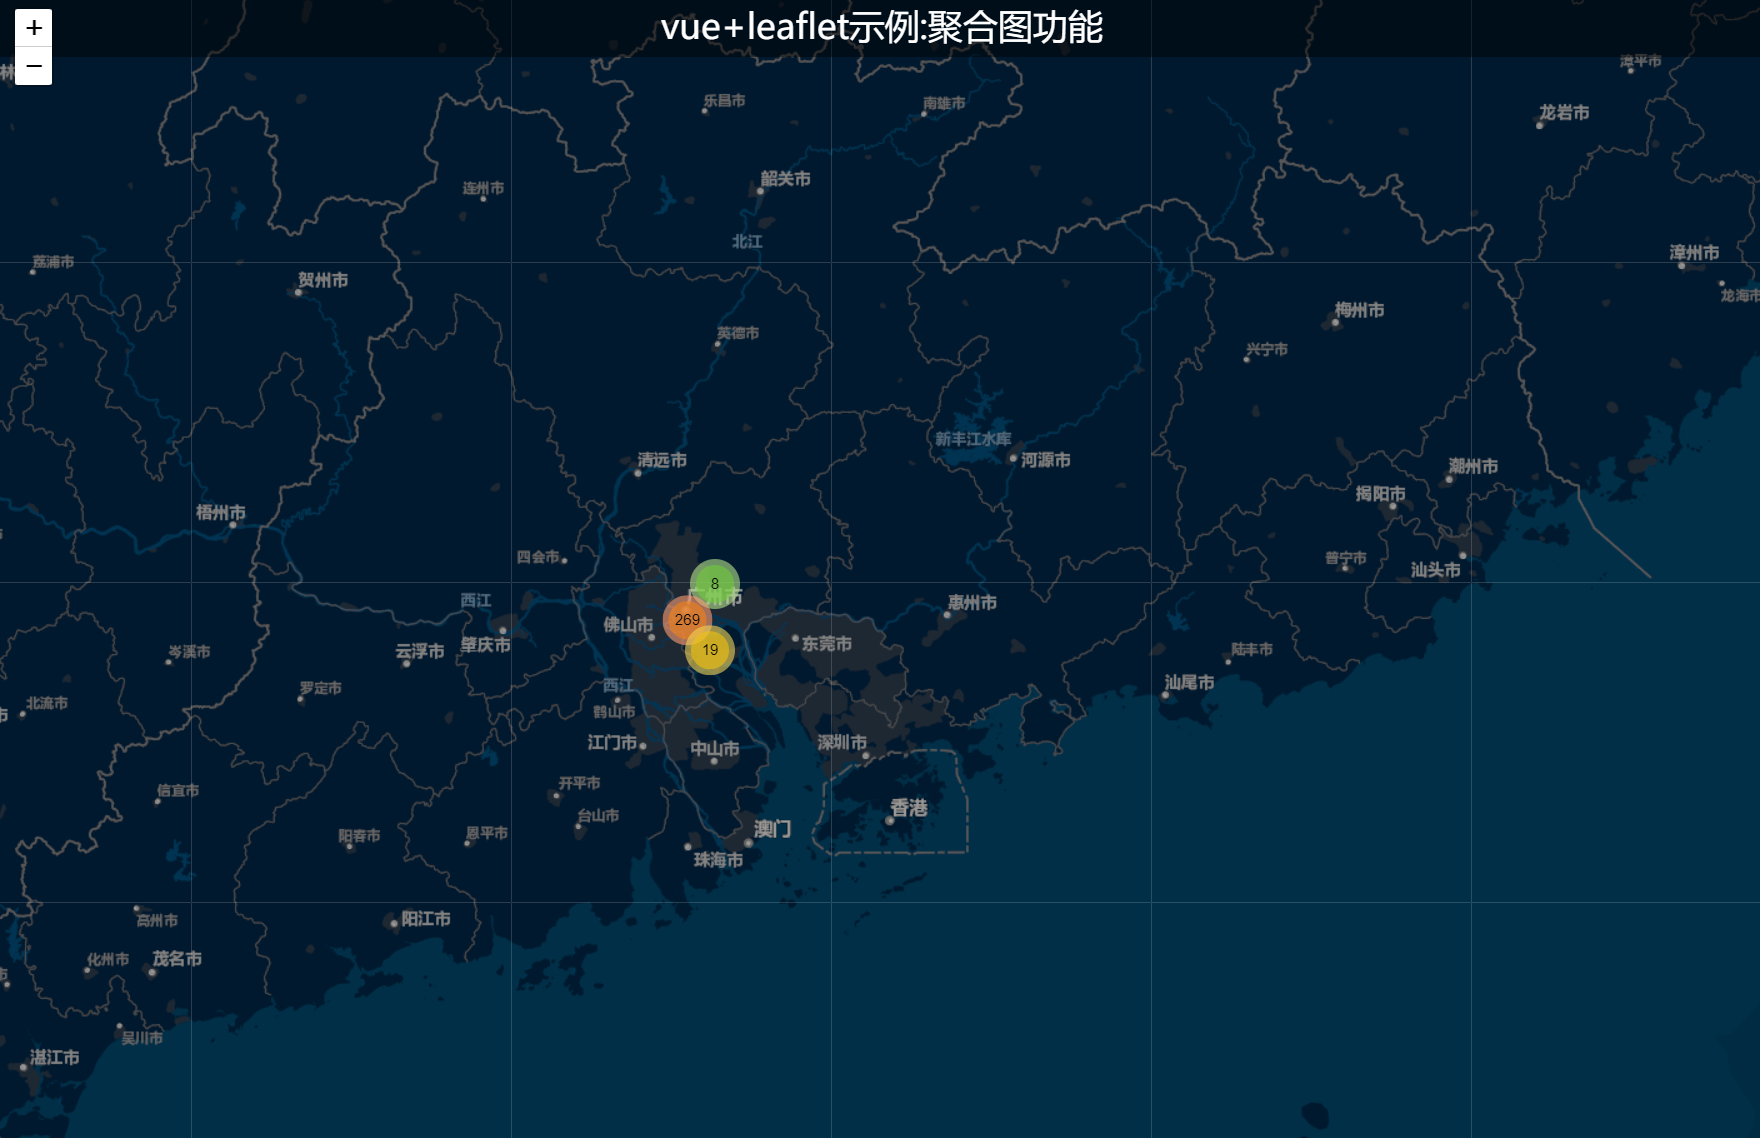
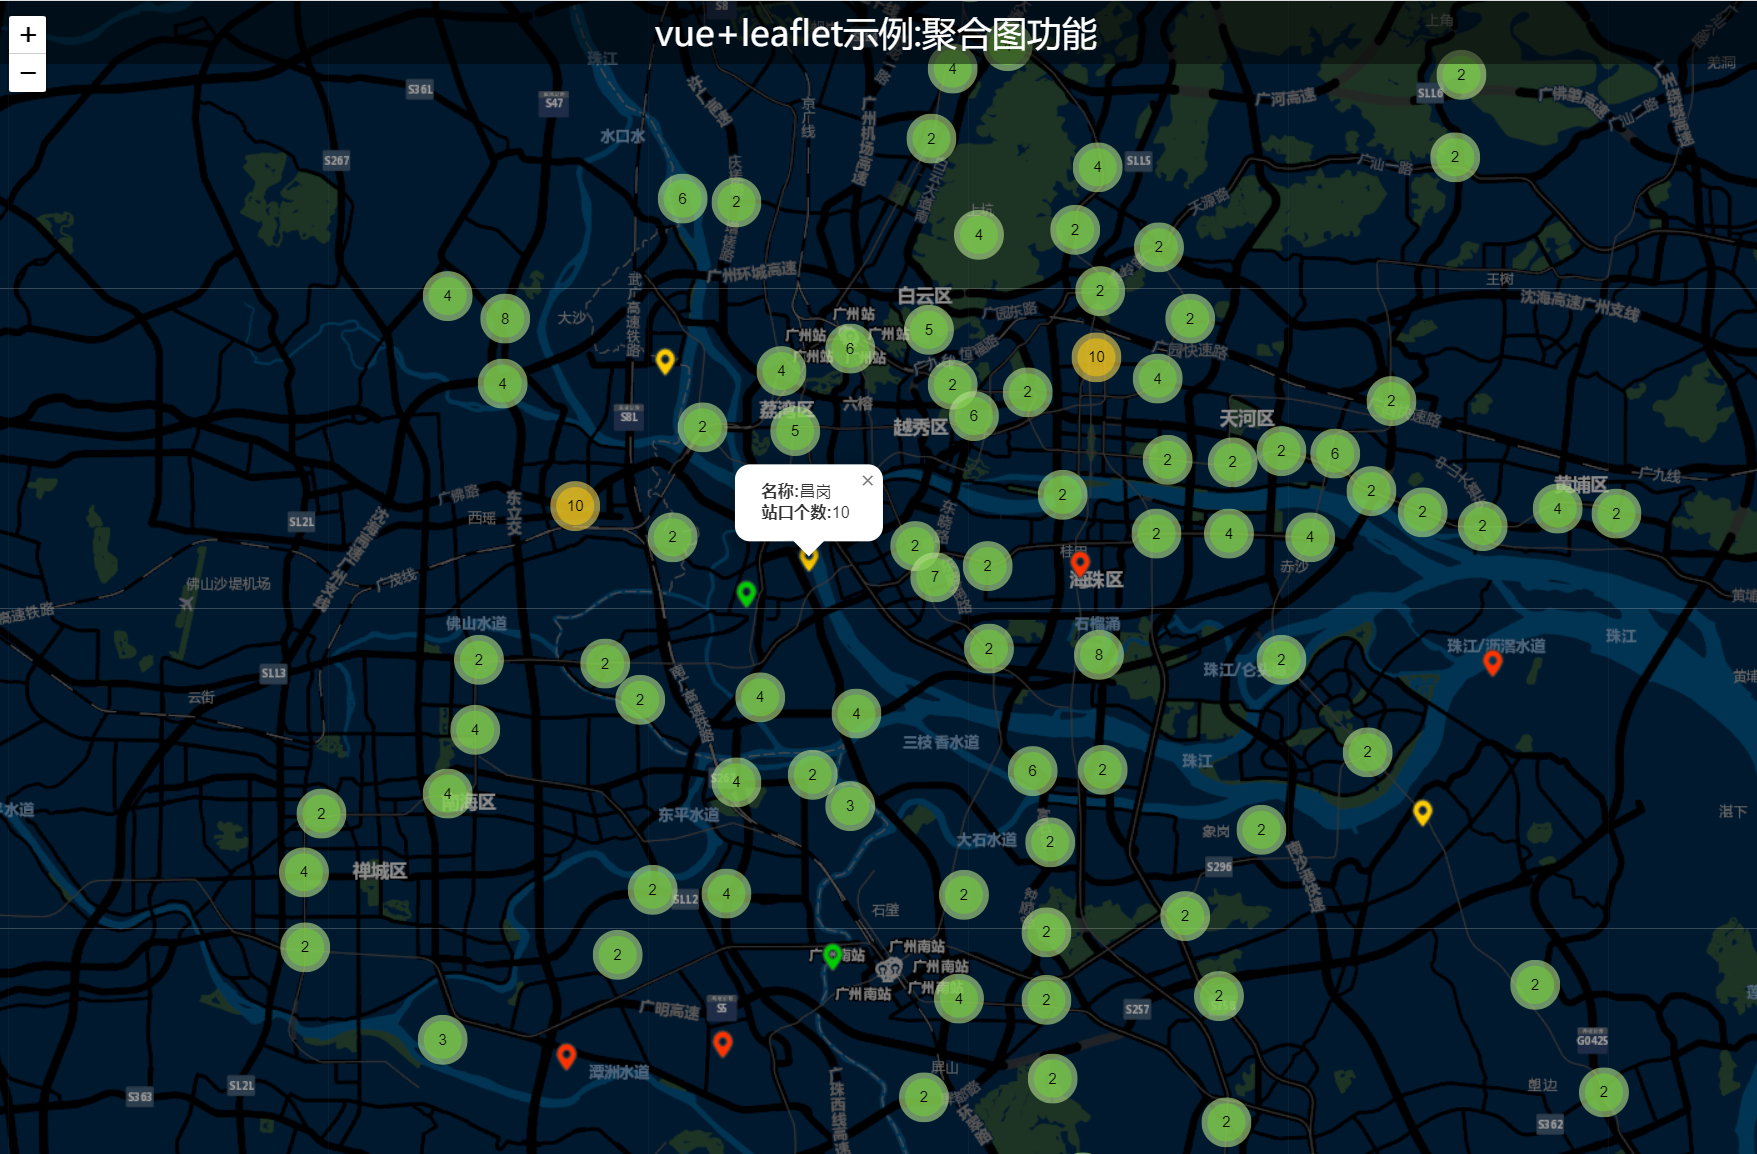
本篇实现的思路:参考leaflet官网聚合效果插件Leaflet.markercluster:https://github.com/Leaflet/Leaflet.markercluster
这个聚合插件具体使用看github地址,那里有详细说明以及例子。
- 核心源码
<template><div id="map" ref="mapDiv"></div><div class="titleContainer center"><span>vue+leaflet示例:聚合图功能</span></div>
</template><script setup>
import { onMounted, reactive, ref } from "vue";
import L from "leaflet";
import "leaflet.markercluster/dist/MarkerCluster.css";
import "leaflet.markercluster/dist/MarkerCluster.Default.css";
import "leaflet.markercluster";
import hgxPic from "@/assets/projectPoint_HGX.png";
import jsztPic from "@/assets/projectPoint_JSZT.png";
import xmxzPic from "@/assets/projectPoint_XMXZ.png";
import xmzsPic from "@/assets/projectPoint_XMZS.png";
// import config from "../config";
// import { useRouter } from "vue-router";
// const router = useRouter();
// const mapDiv = ref(null);
let map = null;
const geojson = {type: "FeatureCollection",features: [{type: "Feature",geometry: {type: "Point",coordinates: [113.16305738210656, 23.13667404697526],},properties: { Name_CHN: "赤岗塔", StationNum: 1, Status: 1 },},{type: "Feature",geometry: {type: "Point",coordinates: [113.10861400100009, 22.993978000000084],},properties: { Name_CHN: "魁奇路", StationNum: 14, Status: 2 },},…………],
};
onMounted(() => {initMap();
});
const initMap = () => {// 创建地图对象map = L.map("map", {attributionControl: false,}).setView(L.latLng(22.95186415, 113.90271877), 9);//创建底图切换数据源const baseLayer = L.tileLayer("http://map.geoq.cn/ArcGIS/rest/services/ChinaOnlineStreetPurplishBlue/MapServer/tile/{z}/{y}/{x}",{ crossOrigin: true });map.addLayer(baseLayer); //地图默认加载的底图//聚合图const projectPointLayer = L.markerClusterGroup({showCoverageOnHover: false,zoomToBoundsOnClick: true,chunkedLoading: true,maxClusterRadius: 40, //默认80}).addTo(map);if (geojson) {addProjectClusterLayers(geojson, projectPointLayer);projectPointLayer.on("click", function (e) {e.layer.unbindPopup();const elements = getProjectPopupContent(e.layer.options.properties);e.layer.bindPopup(elements).openPopup(e.latlng);});}
};
/** 点单击内容函数*/
const getProjectPopupContent =  (item) => {// 内容及单击事件const elements = `<div>${toPopupItemStr("名称", item.Name_CHN)}${toPopupItemStr("站口个数", item.StationNum)}</div>`;return elements;
};
const toPopupItemStr = (name, value) => {return value ? `<b>${name}:</b>${value}<br>` : "";
};
/** 加载聚合图层*/
const addProjectClusterLayers = async (geojson, clusterlayer) => {let markerList = [];if (geojson.features.length > 0) {for (let i = 0; i < geojson.features.length; i++) {if (geojson.features[i].geometry) {const properties = geojson.features[i].properties;const coordinate = geojson.features[i].geometry.coordinates;//根据Status类型不同加载不同图标let img = hgxPic;switch (properties.Status) {case 1:img = hgxPic;break;case 2:img = jsztPic;break;case 3:img = xmxzPic;break;case 4:img = xmzsPic;break;}const myIcon = L.icon({iconUrl: img,iconSize: [25, 25],});const marker = L.marker(new L.LatLng(coordinate[1], coordinate[0]), {properties: properties,icon: myIcon,});markerList.push(marker);}}}clusterlayer.addLayers(markerList);
};
</script><style scoped>
#map {width: 100vw;height: 100vh;
}
.titleContainer {position: absolute;top: 0;background: rgba(0, 0, 0, 0.45);height: 50px;width: 100vw;z-index: 999;font-size: 14px;color: #fff;font-size: 28px;
}
.center {display: flex;flex-direction: column;align-items: center;justify-content: center;
}
</style>