一、Prometheus
获取配置文件
docker run -d -p 9090:9090 --name prometheus prom/prometheus
mkdir -p /app/prometheus
docker cp prometheus:/etc/prometheus/prometheus.yml /app/prometheus/prometheus.yml
停止并删除旧的容器,重新启动
docker run -d --name prometheus -p 9090:9090 -v /app/prometheus/prometheus.yml:/etc/prometheus/prometheus.yml prom/prometheus
访问prometheus
http://XX.xx.xx.xx:9090
二、Grafana
设置grafana映射文件夹
mkdir -p /app/grafana
chmod 777 -R /app/grafana
启动
docker run -d -p 3000:3000 --name=grafana -v /app/grafana:/var/lib/grafana grafana/grafana
默认密码admin admin
三、引入node-exporter监控服务器
docker run -d --name node-exporter -p 9100:9100 \-v /etc/localtime:/etc/localtime -v /etc/timezone:/etc/timezone \prom/node-exporter
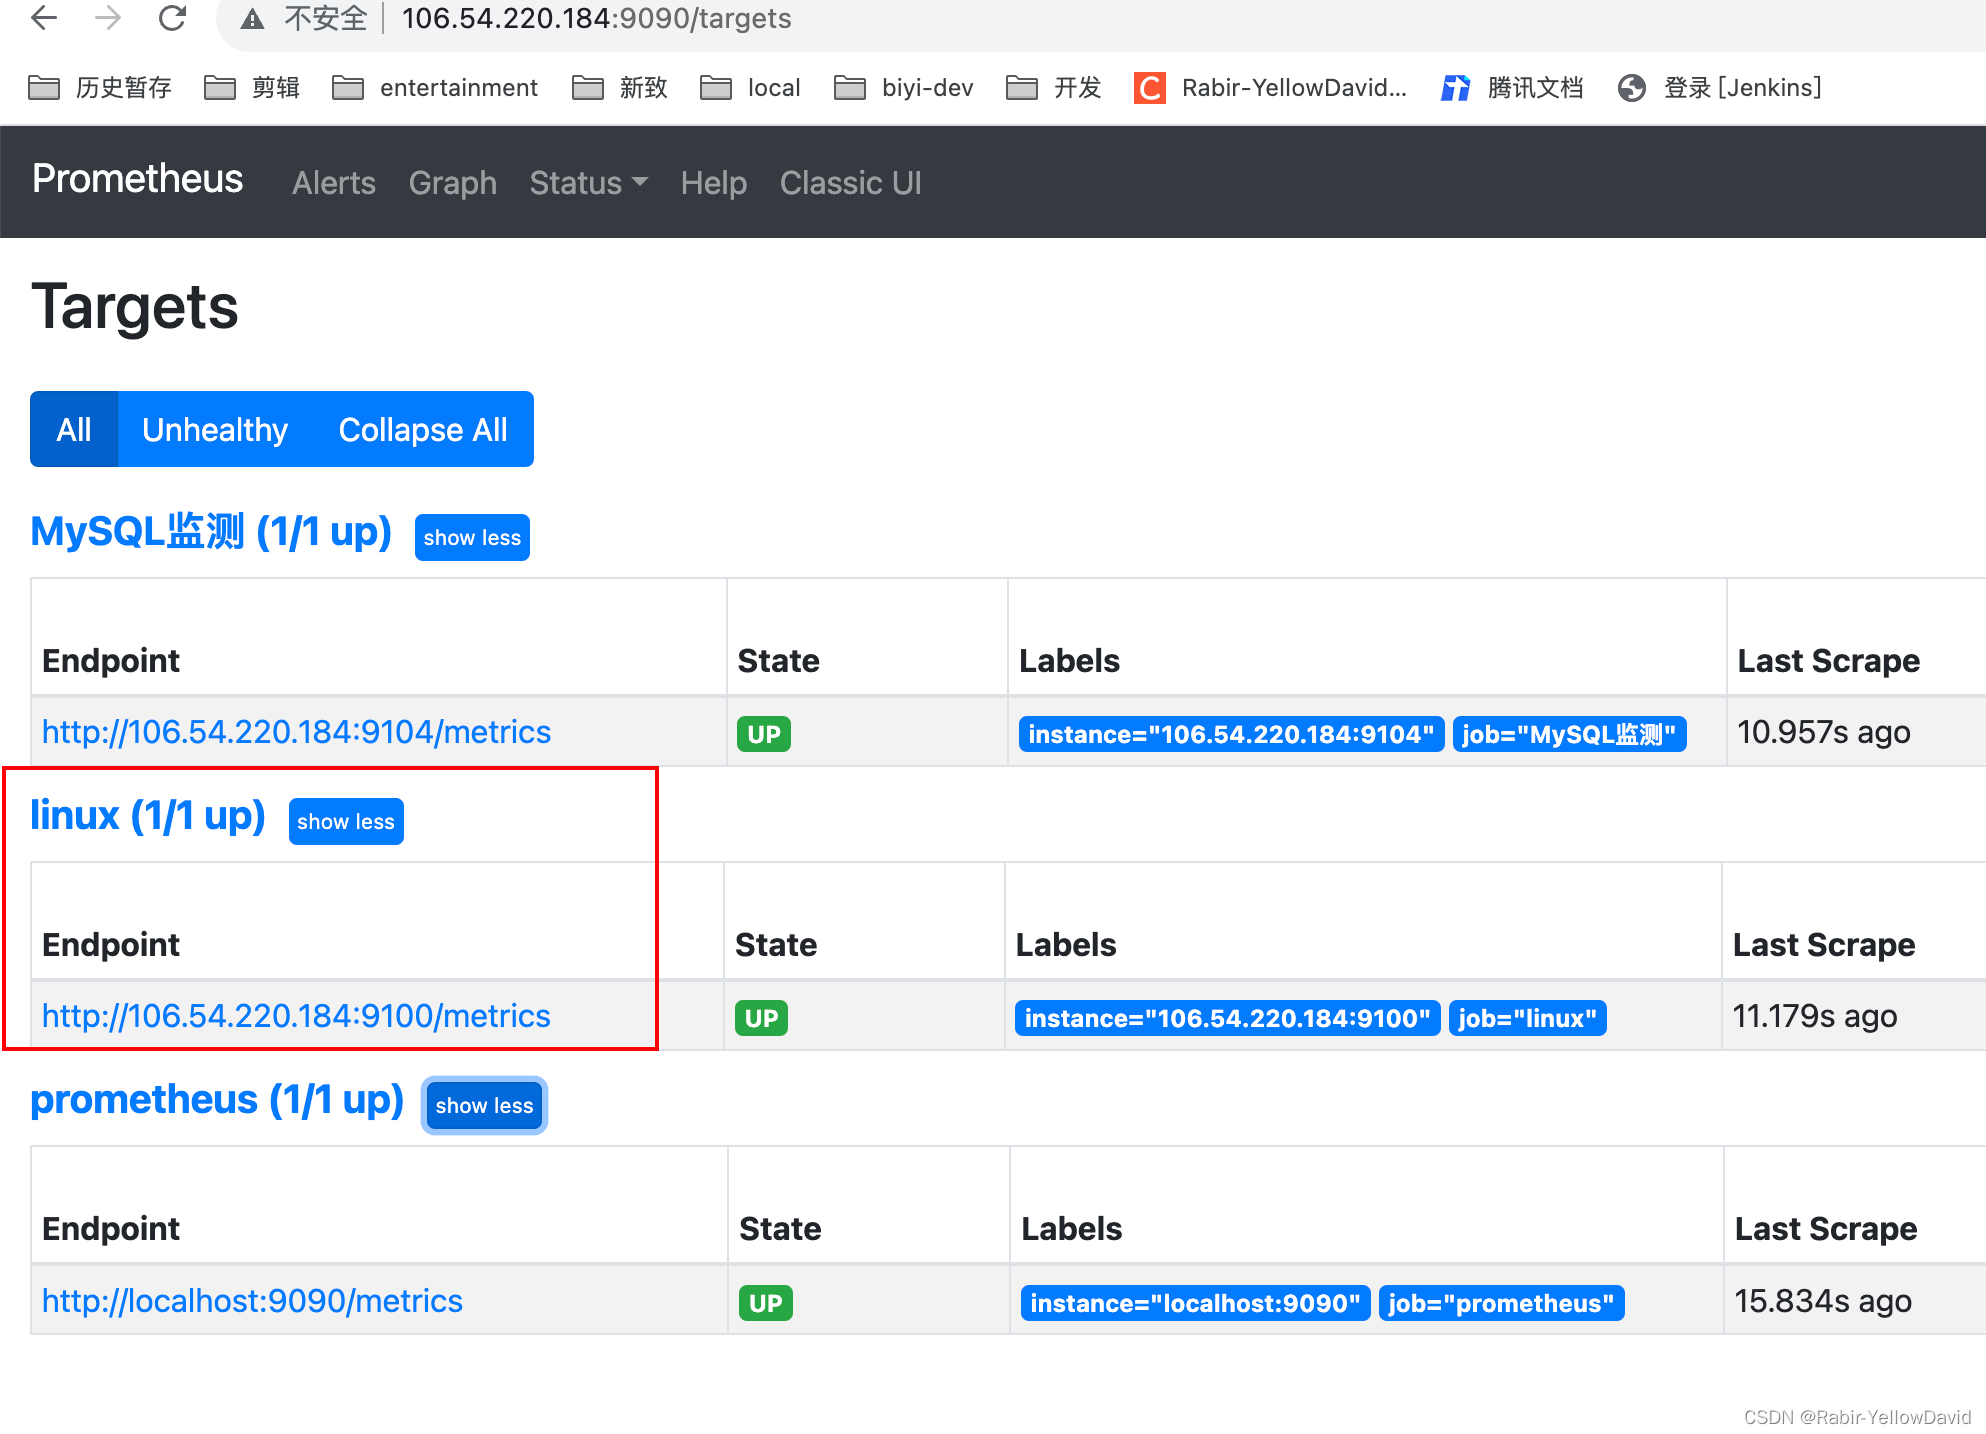
将node-exporter服务暴露公网的ip和端口(内网ip也可以) 配置到Prometheus的prometheus.yml文件中
- job_name: 'linux'static_configs:- targets: ['106.54.220.184:9100']重启容器,查看Prometheus
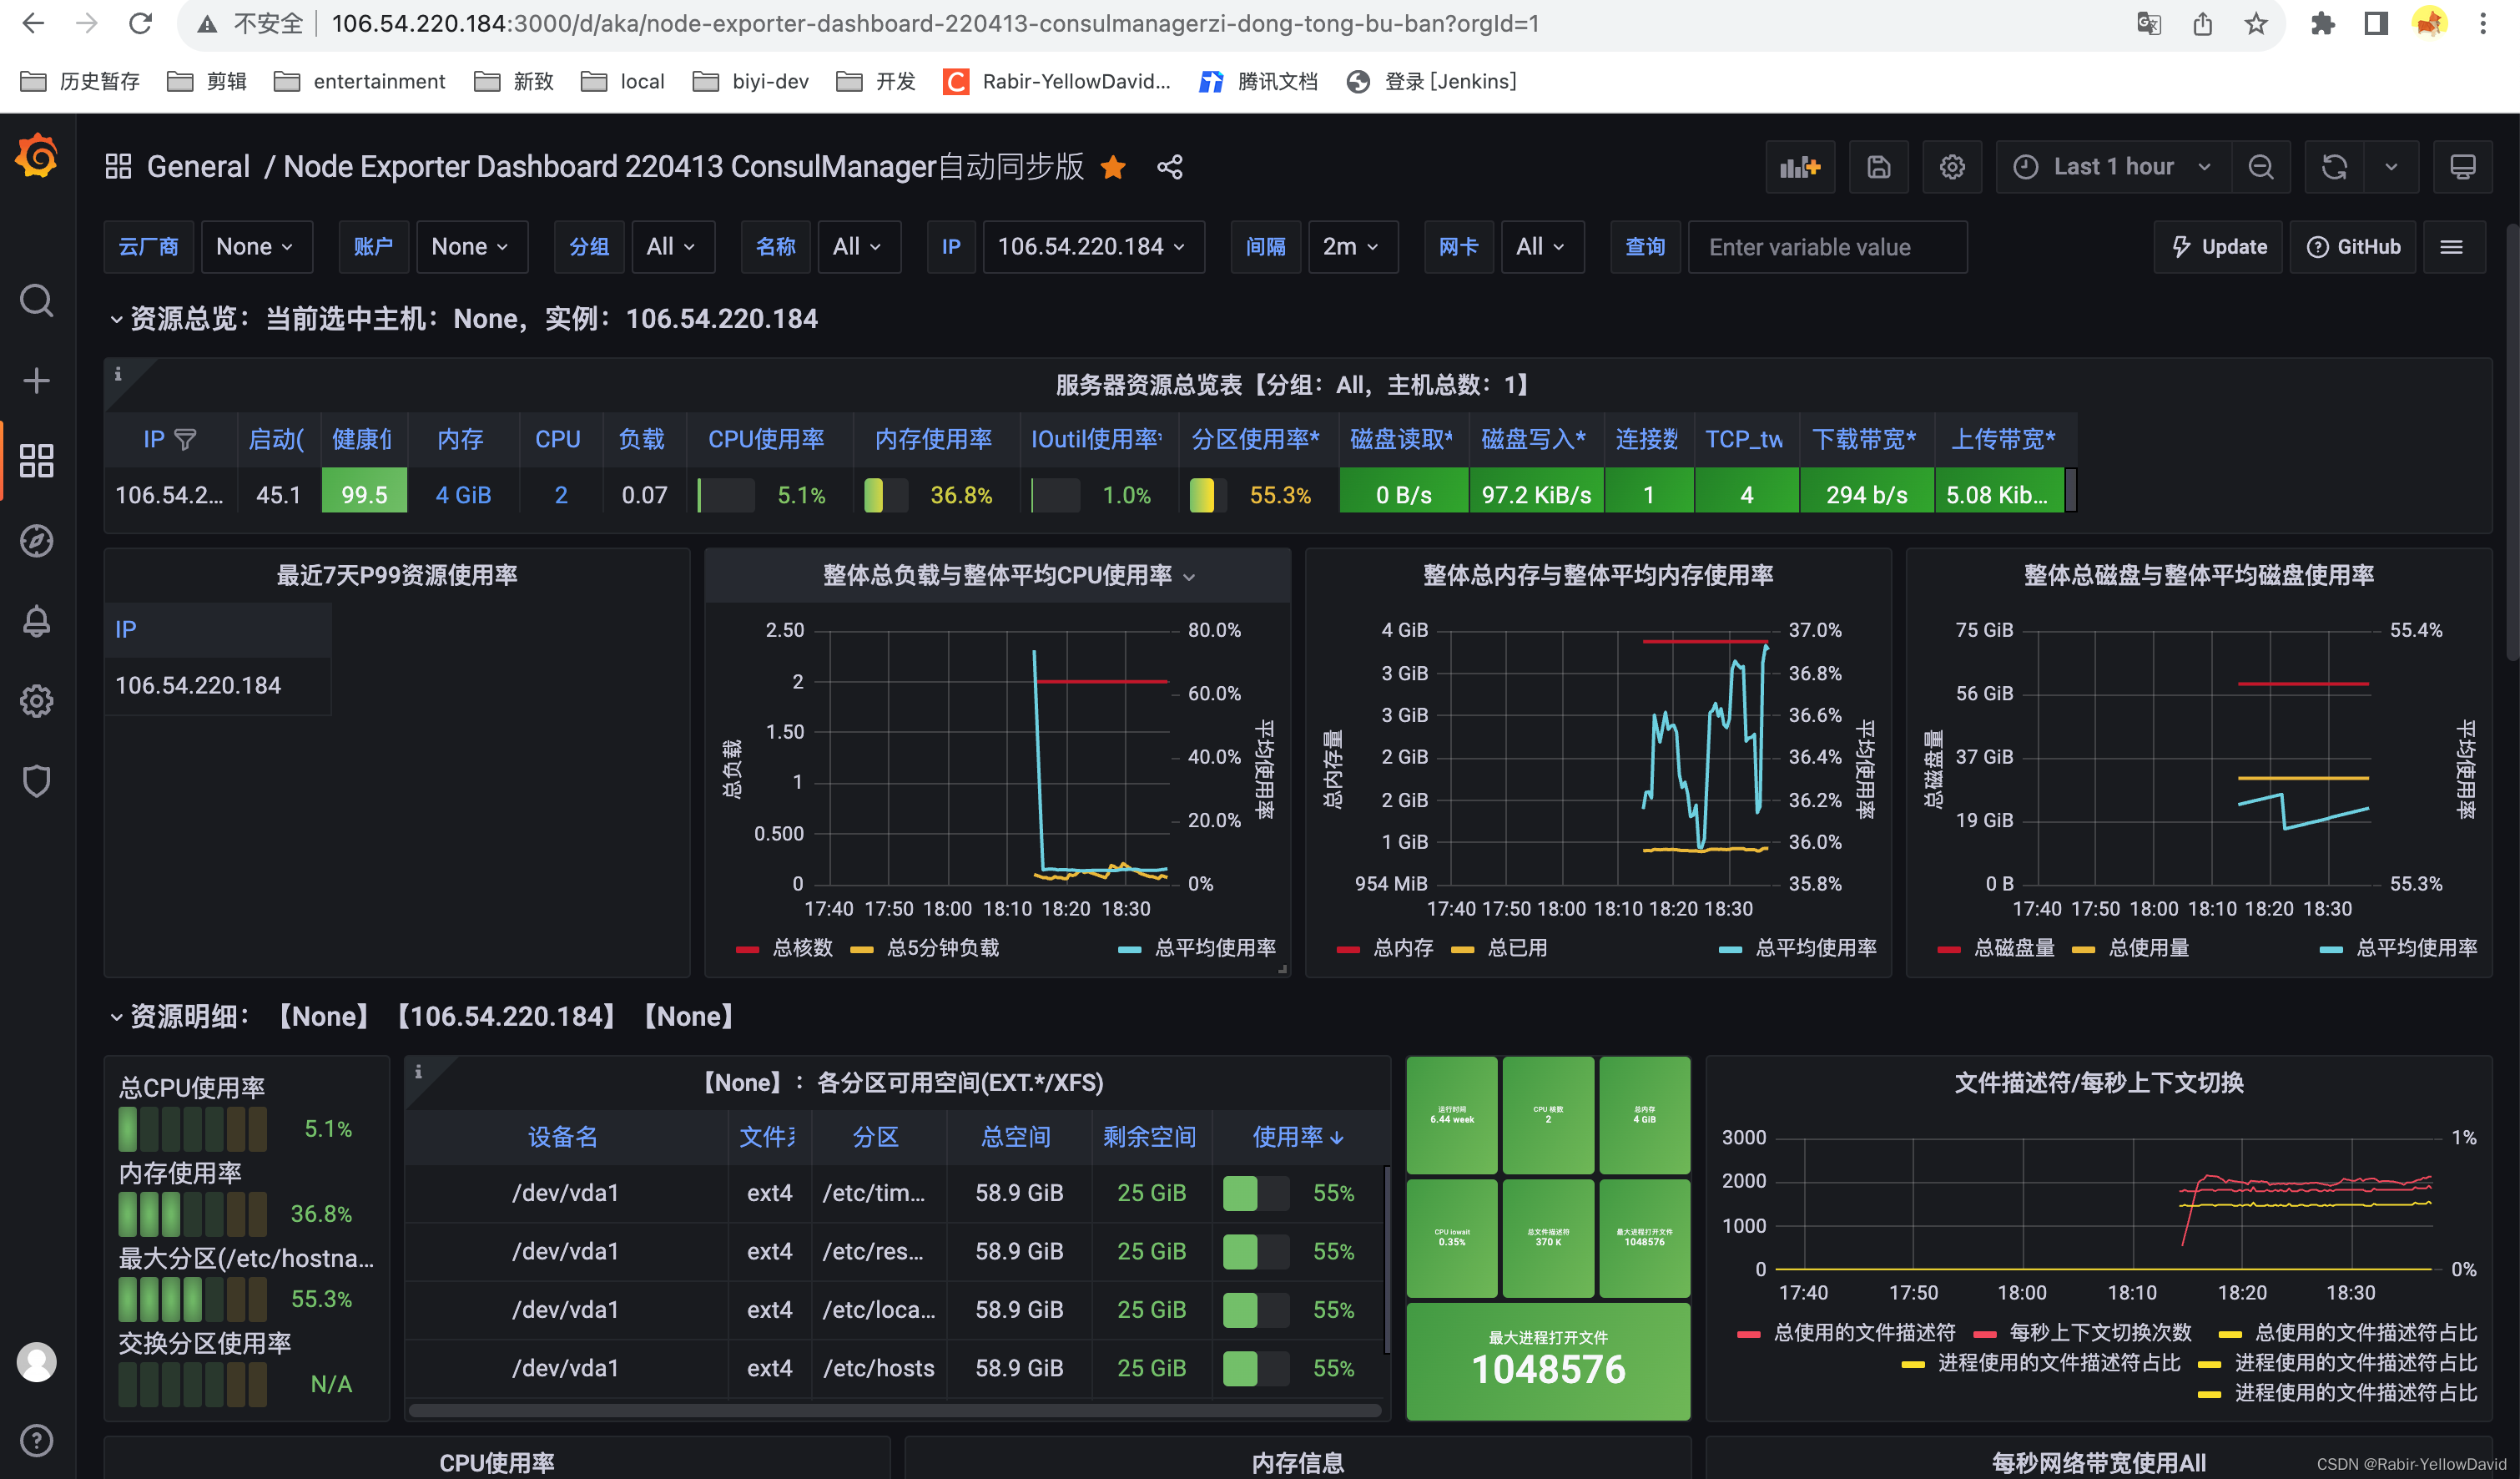
看板:Node Exporter Dashboard 220413 ConsulManager自动同步版
四、引入mysqld-exporter监控Mysql
启动Mysql监听
docker run -d \
--restart=always \
-p 9104:9104 \
--name mysqld-exporter \
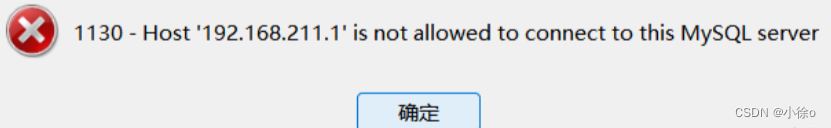
-e DATA_SOURCE_NAME="exporter:用户名:密码(ip:3306)/" \
prom/mysqld-exporter
将mysqld-exporter服务暴露公网的ip和端口(内网ip也可以) 配置到Prometheus的prometheus.yml文件中
- job_name: 'mysql'static_configs:- targets: ['ip:9104']
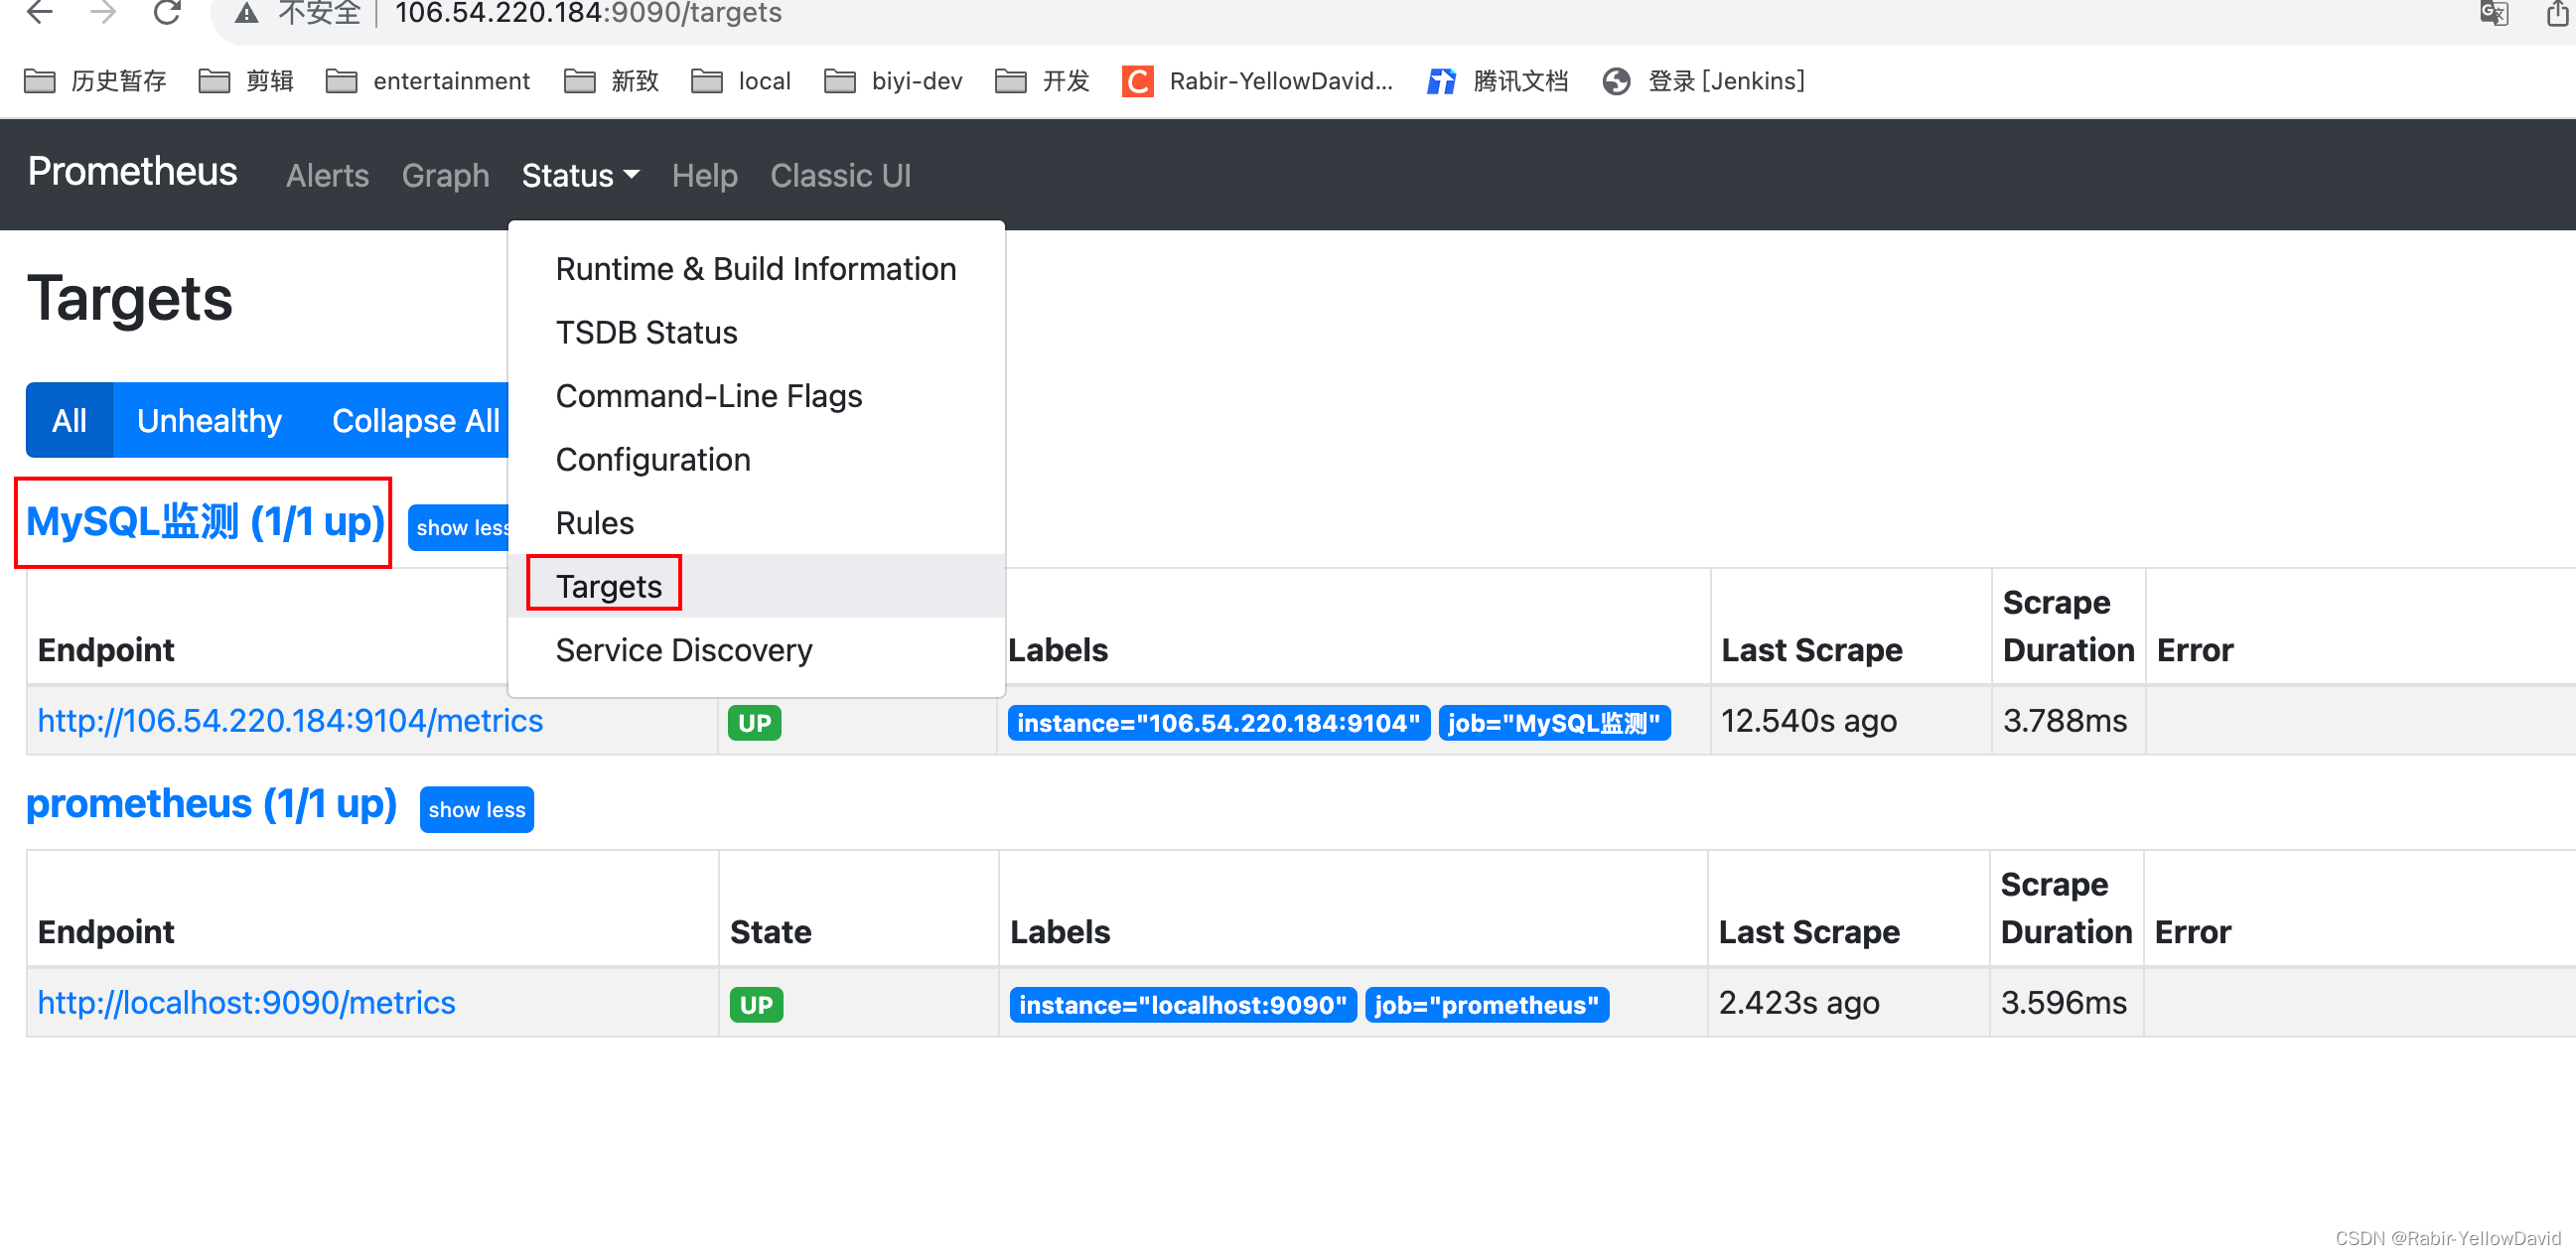
查看普罗米修斯 是否新增了监听
在Grafana配置Prometheus数据源
Configuration -> Data Sources ->add data source -> Prometheus
Configuration -> Data Sources ->add data source -> MySQL
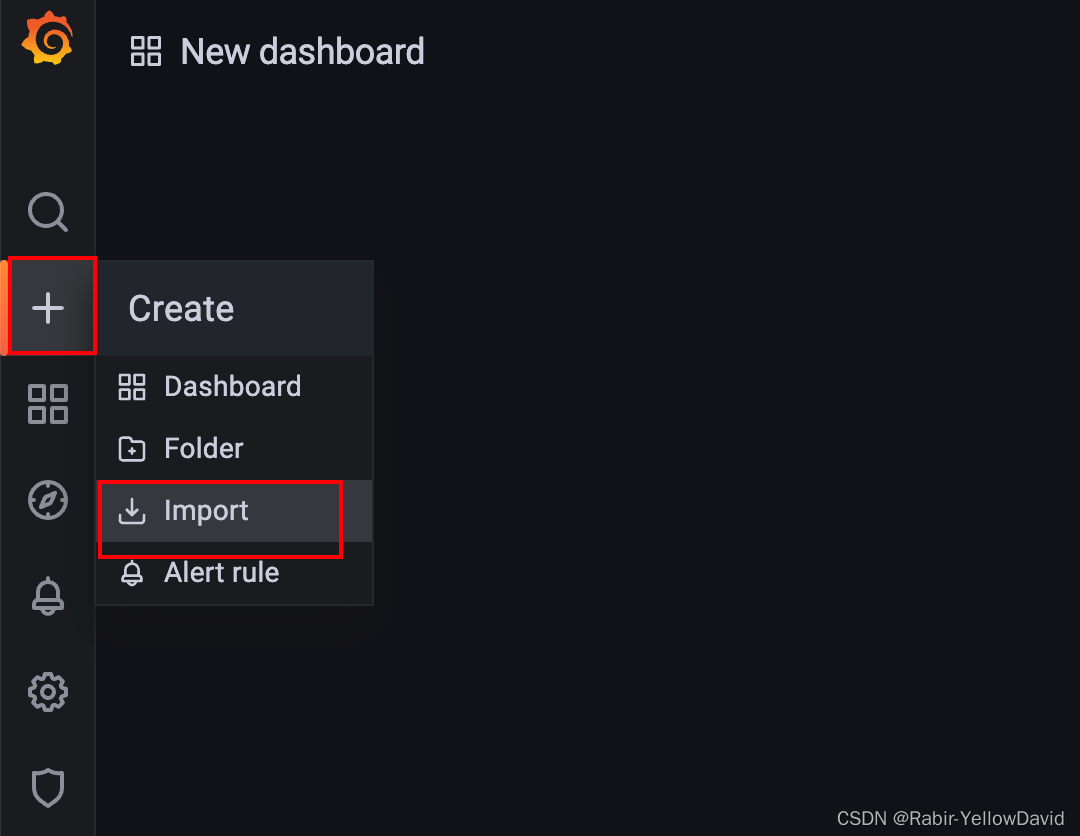
Create import Mysql看板ID:8919
Create import Mysql看板ID:8919