1 数据过滤
过滤参数:过滤掉次等位基因频率(minor allele frequency,MAF)低于0.05、哈达-温伯格平衡(Hardy– Weinberg equilibrium,HWE)对应的P值低于1e-10或杂合率(heterozygosity rates)偏差过大(± 3 SD)的位点:
去除杂合率(heterozygosity rates)偏差过大(± 3 SD)的个体:
假设,基于Plink计算结果,需要移除sample1(高杂合或低杂合):
#vcftools version:
nohup vcftools --vcf snps_filtered.vcf --remove-indels --maf 0.05 --hwe 1e-10 --max-missing 0.8 --min-meanDP 20 --max-meanDP 500 --remove-indv sample1 --recode --stdout > snps_maf0_05_hwe1e-10_missing0_8.vcf &vcftools生成的文件中会包含命令行输出,使用sed移除:
nohup sed -i '1,30d' snps_maf0_05_hwe1e-10_missing0_8.vcf &
压缩:
bgzip snps_maf0_05_hwe1e-10_missing0_8.vcf
tabix snps_maf0_05_hwe1e-10_missing0_8.vcf.gz
2 计算 F S T 、 D X Y 、 P i F_{ST}、D_{XY}、Pi FST、DXY、Pi
安装软件包
nohup pixy --stats pi fst dxy --vcf snps_maf0_05_hwe1e-10_missing0_8.vcf.gz --populations pop.txt --window_size 10000 --bypass_invariant_check 'yes' --n_cores 15 --output_folder results &3 可视化
可视化之前需要将染色体编号替换为数值:
bash ~/gaoyue/GWAs/script/chr_tran.sh raw_results/pixy_dxy.txt results/pixy_dxy.txt
bash ~/gaoyue/GWAs/script/chr_tran.sh raw_results/pixy_fst.txt results/pixy_fst.txt
bash ~/gaoyue/GWAs/script/chr_tran.sh raw_results/pixy_pi.txt results/pixy_pi.txt
#load packages:
library(ggplot2)
library(tidyverse)#---------------------------------------------------------------------------------#
#             1.define a function to convert the pixy outputs                     #
#---------------------------------------------------------------------------------#
pixy_to_long <- function(pixy_files){pixy_df <- list()for(i in 1:length(pixy_files)){stat_file_type <- gsub(".*_|.txt", "", pixy_files[i])if(stat_file_type == "pi"){df <- read_delim(pixy_files[i], delim = "\t")df <- df %>%gather(-pop, -window_pos_1, -window_pos_2, -chromosome,key = "statistic", value = "value") %>%rename(pop1 = pop) %>%mutate(pop2 = NA)pixy_df[[i]] <- df} else{df <- read_delim(pixy_files[i], delim = "\t")df <- df %>%gather(-pop1, -pop2, -window_pos_1, -window_pos_2, -chromosome,key = "statistic", value = "value")pixy_df[[i]] <- df}}bind_rows(pixy_df) %>%arrange(pop1, pop2, chromosome, window_pos_1, statistic)}#---------------------------------------------------------------------------------#
#                      2.use new function we just defined:                        #
#---------------------------------------------------------------------------------#
## Rcau则替换为对应的文件夹
pixy_folder <- "/nfs_fs/nfs3/gaoyue/gaoyue/Fst/Rdeb_Fst/results/"
pixy_files <- list.files(pixy_folder, full.names = TRUE)
pixy_df <- pixy_to_long(pixy_files)#---------------------------------------------------------------------------------#
#                                      3.plot:                                    #
#---------------------------------------------------------------------------------#
# create a custom labeller for special characters in pi/dxy/fst
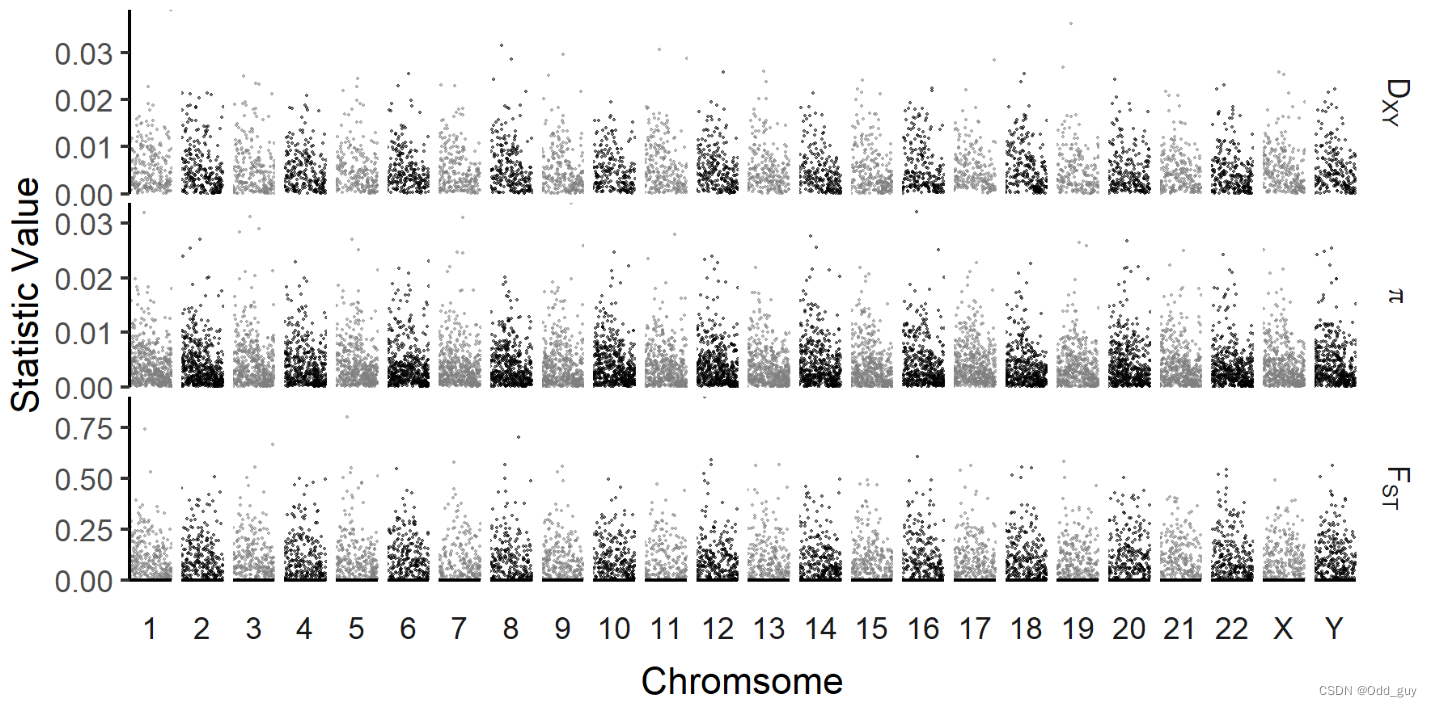
pixy_labeller <- as_labeller(c(avg_pi = "pi",avg_dxy = "D[XY]",avg_wc_fst = "F[ST]"),default = label_parsed)# plotting summary statistics across all chromosomes
pixy_df %>%mutate(chrom_color_group = case_when(as.numeric(chromosome) %% 2 != 0 ~ "even",chromosome == "X" ~ "even",TRUE ~ "odd" )) %>%mutate(chromosome = factor(chromosome, levels = c(1:22, "X", "Y"))) %>%filter(statistic %in% c("avg_pi", "avg_dxy", "avg_wc_fst")) %>%ggplot(aes(x = (window_pos_1 + window_pos_2)/2, y = value, color = chrom_color_group))+geom_point(size = 0.5, alpha = 0.5, stroke = 0)+facet_grid(statistic ~ chromosome,scales = "free_y", switch = "x", space = "free_x",labeller = labeller(statistic = pixy_labeller,value = label_value))+xlab("Chromsome")+ylab("Statistic Value")+scale_color_manual(values = c("grey50", "black"))+theme_classic()+theme(axis.text.x = element_blank(),axis.ticks.x = element_blank(),panel.spacing = unit(0.1, "cm"),strip.background = element_blank(),strip.placement = "outside",legend.position ="none")+scale_x_continuous(expand = c(0, 0)) +scale_y_continuous(expand = c(0, 0), limits = c(0,NA))
Ending!
